Thanks for reading! If you haven’t subscribed, please click the button below:
By subscribing you’ll join over 17,000 people who read Apricitas weekly!
Otherwise, liking or sharing is the best way to support my work. Thank you!
The first outbreaks of COVID-19 inspired a renewed and reinvigorated focus on supply-chains issues in economics and popular culture. Pictures of empty shelves were a commonplace symbol of the early pandemic, chip shortages helped cause the first rise in inflation back in early 2021, and the backlog of cargo ships outside the Port of Los Angeles became a hotly-debated matter of national importance last year.
Today, however, the story is different. Inflation is increasingly broad-based and is very high in service sector industries that should be less affected by supply-chain issues. Gasoline prices, the most in-your-face indicator of supply-chain issues, have dropped more than $1 a gallon from their highs. Popular focus on detailed supply-chain stories has fallen a bit to the wayside.
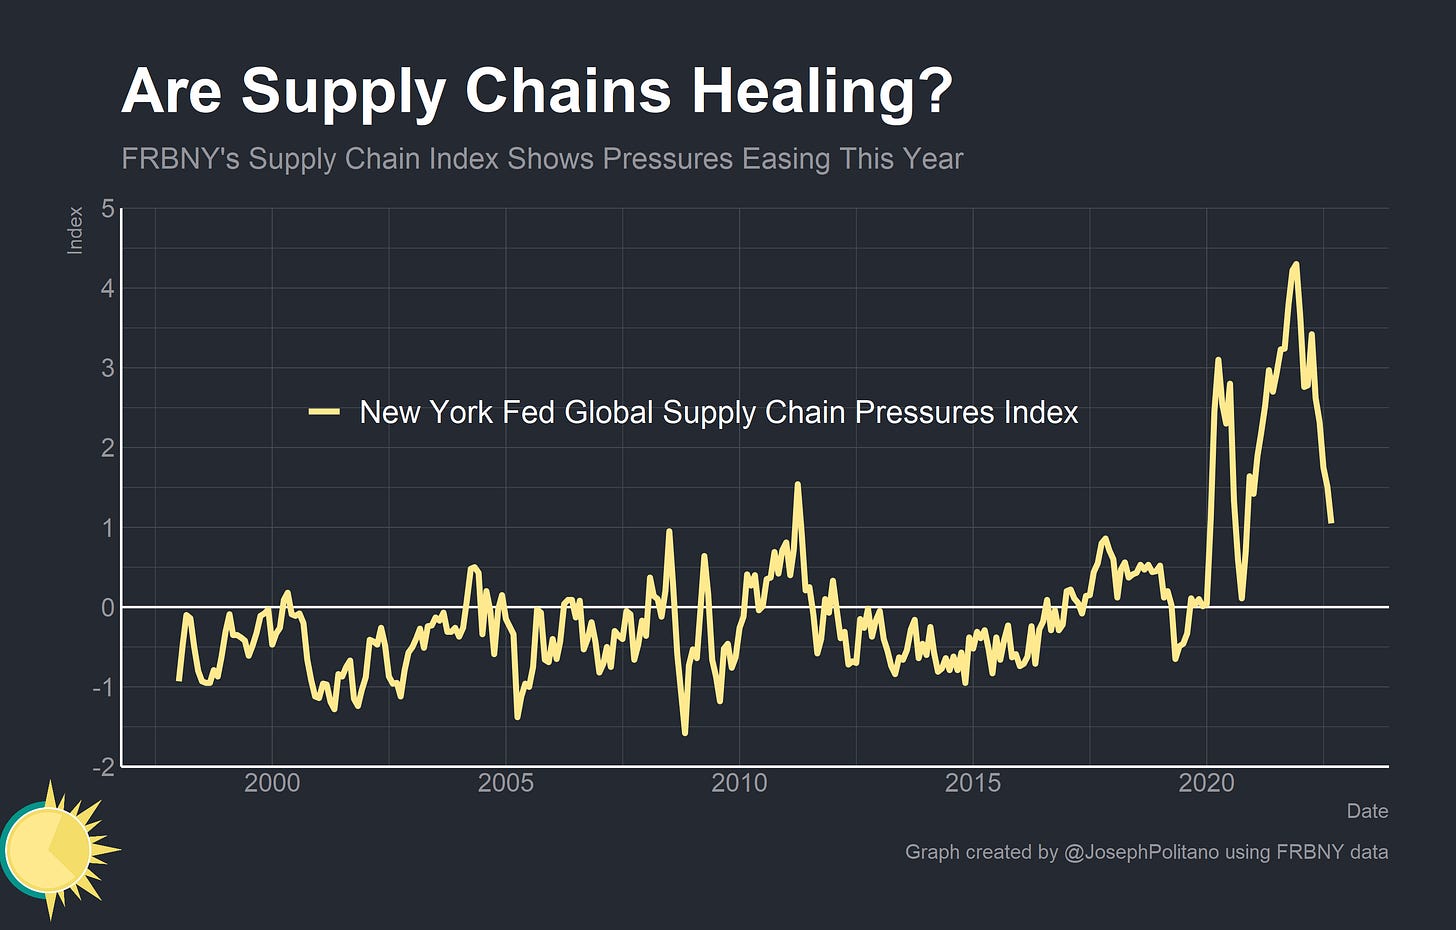
At the same time, there are some critical indications that supply chain pressures have been alleviating since the start of this year. US motor vehicle production has picked up to pre-pandemic levels after weathering the semiconductor shortage of last year, manufacturing output is inching closer to record highs, and transoceanic transportation costs are plummeting. The Global Supply Chains Pressures Index (GSPCI) that the Federal Reserve Bank of New York rolled out last year is rapidly moving towards pre-pandemic levels.
But is supply improving? Or is demand just falling? After all, the New York Fed cannot perfectly isolate supply-side factors from demand-side ones—as they essentially admit.
Movements in the GSCPI’s underlying data—both the country-specific PMI components as well as the transportation cost series—can be due to changes in either demand- or supply-side factors. To better isolate the supply-side drivers of each data series, we use additional information available from the PMI [Purchasing Managers’ Index] surveys for our set of seven economies.
Reasoning directly from price changes, as the GSCPI partially does, is one of the biggest pitfalls in economics. Sure, freight transportation costs could be falling as ports work through their backlog of orders, but freight transportation costs could also be falling if rising recession fears are producing a massive drop in demand. So to what degree is supply improving—and to what degree is demand deteriorating?
Taking Inventory
Teasing out the answer to that question is surprisingly difficult—but one place to start is in inventory/sales ratios. The collapse in demand at the onset of the pandemic led to a massive drop in sales and a spike in the ratio, but the ensuing years were dominated by rising sales figures and dwindling inventories that pulled the ratios down, especially for retailers. Starting in 2022, alleviating supply chain pressures meant that businesses built up much healthier—though still below pre-pandemic—relative inventory levels. However, demand slowdowns are currently somewhat visible in core retail sales data.
Putting aside prices altogether can also reveal some valuable insights. The price of transoceanic cargo transportation may be rapidly returning to normal-ish levels, but the time it takes for cargo to reach the US remains elevated. The Flexport Ocean Timeliness indicator, which measures the average number of days from when cargo is marked ready to export in China to when it is officially imported in the US/Europe, shows delivery times steadily decreasing since the first few months of this year but still remaining well pre-pandemic levels. A disproportionate chunk of those gains also come from improving origin port conditions (the time it takes to get goods out of China) while destination port conditions (the time it takes to get goods into the US) lag behind. Still, the ISM’s Purchasing Manager’s Index shows slowly increasing delivery times for materials from suppliers—indicating that quicker transportation speeds may not have shown up as faster deliveries to manufacturers yet.
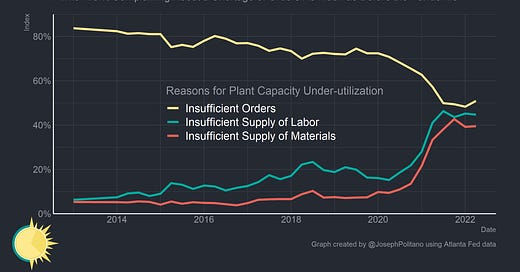
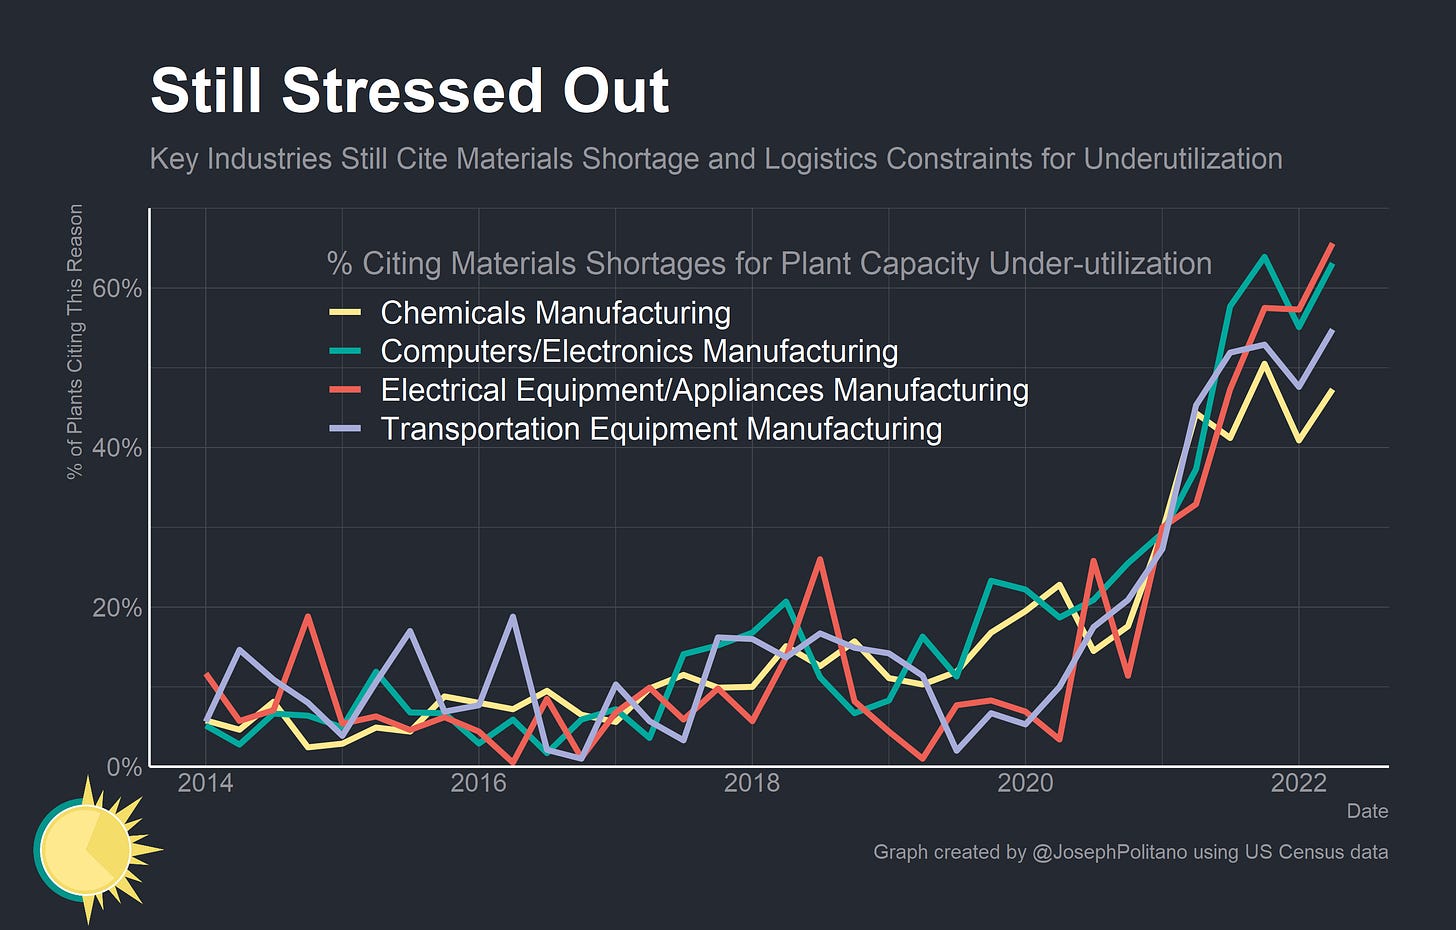
Another approach is to just ask plant managers directly about the state of their supply chains—that’s what the Census Bureau’s Quarterly Survey of Plant Capacity Utilization does. In addition to measuring the production and capacity of US manufacturers, the survey asks managers to list the factors that explain why they aren’t running at full capacity. The share of managers citing materials shortages or transportation constraints (respondents can select multiple answers) has risen dramatically over the last couple of years as supply chain pressures started to bite—and critically, little relief has appeared so far this year.
In fact, many critical manufacturing industries like chemicals, computers, electrical equipment, and transportation equipment are still under extreme supply chain pressures and, in some cases, have seen materials shortages worsen this year. The good news is that domestic output is above pre-pandemic levels for all of these important items—but that just highlights how complicated it can be to disentangle supply and demand effects.
Supply and Demand Chains
Take the main reason why plants run below full capacity in normal times and today—insufficient orders. Production is demand constrained the vast majority of the time as manufacturing firms tend to have little difficulty obtaining inputs but significant difficulty in coaxing consumers to buy their products. This makes surplus capacity arguably the defining feature of industrial economic management. However, a massive surge in new orders can overwhelm this surplus capacity—and when everyone’s capacity is overwhelmed at once the economic paradigm can shift towards capacity shortages and combative fights over input materials.
Keep reading with a 7-day free trial
Subscribe to Apricitas Economics to keep reading this post and get 7 days of free access to the full post archives.


