Inflation and the Supply Chain Crisis
Red-hot Inflation is Driven Mostly by Rising Goods Prices—Themselves a Byproduct of a Supply Chain in Crisis.
The views expressed in this blog are entirely my own and do not necessarily represent the views of the Bureau of Labor Statistics or the United States Government.
The Consumer Price Index rose 7.5% over the last year—the highest rate in nearly 40 years. The defining aspect of this pandemic inflation has been the unprecedented surge in goods prices as a result of increased demand from COVID-isolated consumer and, critically, extreme strain on supply chains. Partially, this is a crisis of abundance—real consumption and production of many critical goods have increased since the start of the pandemic, just not enough to offset the increase in relative demand. In many cases, however, this is caused by a decline in real output and consumption due to COVID-induced supply chain issues.
Understanding the supply chain issues facing goods producers is critical to understanding the current bout of inflation, and focusing on the supply chain crisis will be important in understanding how or when inflation abates. This includes the extreme stress in energy markets that have propelled inflation higher in the US and EU alongside the stress in ports and other transportation sectors that are interfering with the movement of goods. Fixing the supply chain crisis will take time, but we may be seeing the first signs that pressures may finally be easing.
The Supply Chain Crisis
As mentioned before, durable goods prices have been a critical aspect of inflationary pressures over the last year. Since durable goods represent about 11% of the CPI, the rapid growth in durable goods prices are responsible for approximately 2% of the total 7.5% inflation over the last year. The vast majority of that surge in prices comes from motor vehicles; the price of new vehicles are up 12% over the last year and the price of used vehicles are up 40%. Motor vehicle parts are experiencing a similar shock; their prices are up 12% over the last year as well.
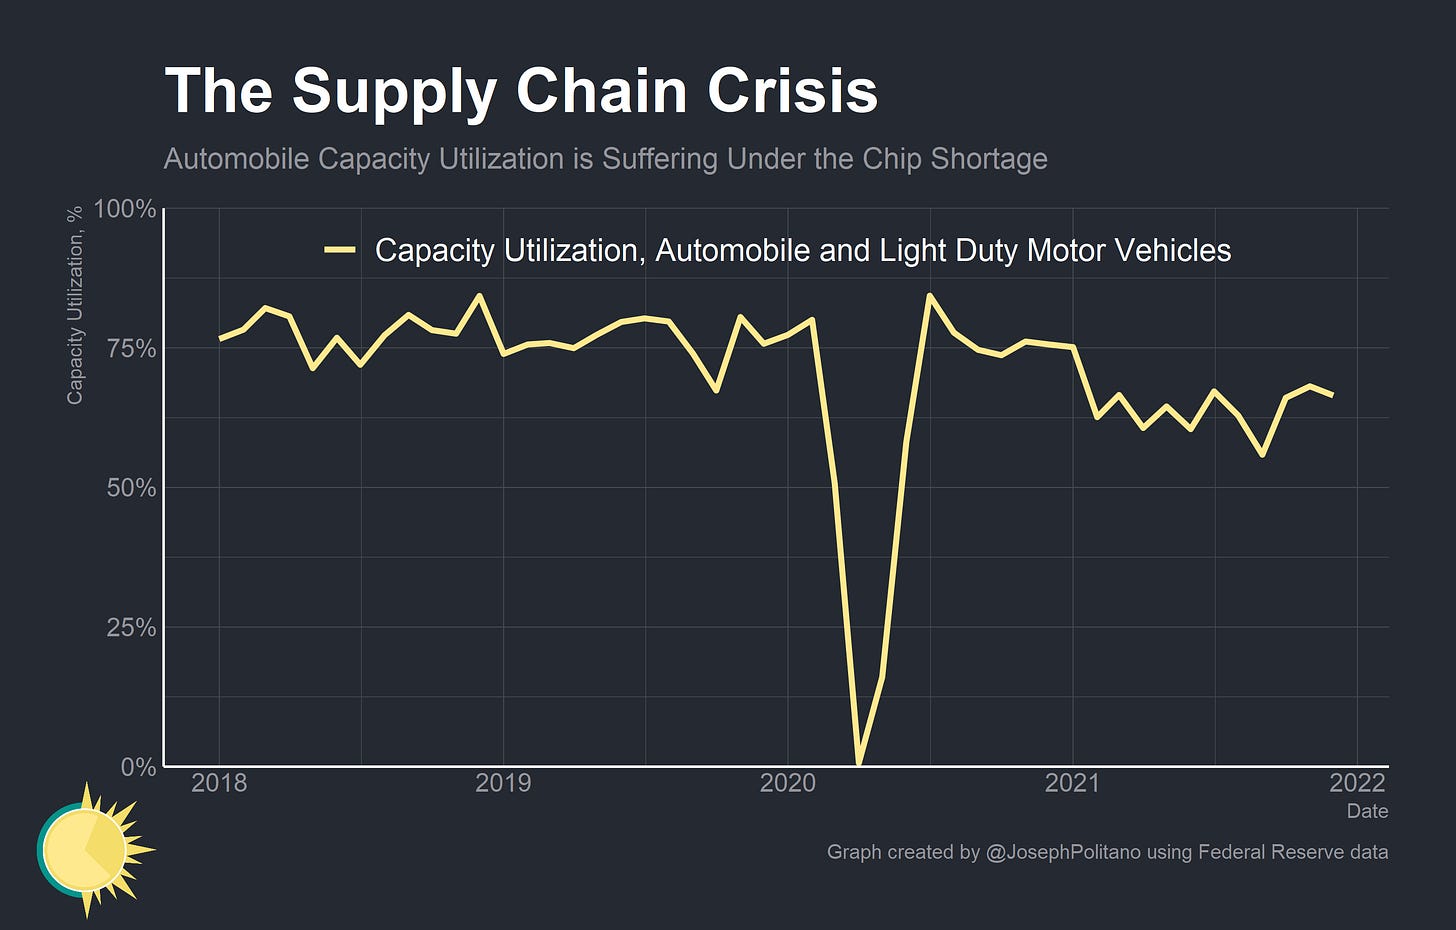
The core cause of this has been a dramatic decrease in the production of motor vehicles. At the start of the pandemic, vehicle assemblies dipped practically to zero—and they have struggled to return to pre-COVID levels. Capacity utilization, which measures the percent of total capacity that is currently used in production, has been falling throughout 2021 due to the effects of an acute shortage of semiconductors. Fearing a permanent loss of demand, automobile manufacturers cancelled orders of semiconductors at the beginning of the pandemic. When demand roared back they were unable to procure more semiconductors, and it is only recently that production has started to recover. The result is that there are approximately 3.7 million fewer new vehicles than would be expected in a no-pandemic counterfactual, and prices have shot up. With limited resources, automakers have prioritized the larger, more expensive models (like Ford F-150s), making the shortage of low-end vehicles even more acute. Automakers expect production disruptions to ease going forward, but significant issues still persist: Ford and Toyota are again scaling production back due to chip shortages, GM is cancelling shifts due to a protest blockade at the US-Canada border that is interrupting parts deliveries, and some automakers are being forced to idle capacity by Omicron lockdown measures abroad.
Automakers were far from the only manufacturers that suffered supply disruptions. The Institute for Supply Management’s (ISM) Manufacturing Purchasing Managers Index (PMI) provides important context on the state of the US goods supply chain that helps illuminate this fact. As indicated in the chart above, every month since the start of the pandemic more firms have seen supplier delivery times grow than shrink. Keep in mind that ISM data is measured as a change from the previous month, meaning that average supplier delivery times have been continually increasing for a large chunk of firms since the start of 2020.
Indeed, average lead times (the period in between the placement and receipt of an order) for production materials have been steadily rising throughout 2021. Growth has abated in recent months, but average lead times remain in excess of three months and nearly 30% above their pre-pandemic level.
On the other side of the supply chain, manufacturing customers have seen their inventories steadily shrink throughout the last two years. At its peak, more than 50% of manufacturing customers reported inventories that were too low—more than double the pre-pandemic average.
The pricing pressure in the manufacturing industry is also enormous; at the peak of mid 2021, more than 75% of firms were reporting an increase in prices paid for raw materials and inputs and virtually none were reporting decreases in prices. Price growth seems to have moderated later in 2021, but input costs are high and still growing for the majority of manufacturers.
The one slight bright spot has been the consistent uptick in production throughout most of 2021. After the dramatic initial shock in early 2020, a large plurality of respondents have indicated increasing month-on-month production ever since. It’s hard to gauge exactly how close American production is to a full recovery, but the Federal Reserve’s Industrial Production Index shows a nearly-complete aggregate recovery (with increased production in some industries compensating for lagging production in others). Still, aggregate production is only at 2019 levels in the face of much-higher-than-2019 aggregate demand for goods. Importantly, key energy and transportation items are key pain points in the goods supply chain.
Energy and Cargo
Crude oil prices have rapidly increased over the last couple years, with West Texas Intermediate (WTI) crude crossing $90 recently against a $60 pre-pandemic price. Energy prices alone have contributed nearly 1% to inflation over the last year. Rising gas prices have hit American consumers hard, but they have also contributed to supply chain issues for manufacturing firms. Oil is a key raw input into many manufactured goods, and energy prices feed directly into the costs for many firms. Additionally, rail and trucking transportation costs are directly affected by rising diesel prices. So what’s keeping oil prices so high?
Rory Johnston at Commodity Context breaks it down in more detail, but essentially US oil producers have not responded to higher prices with the production levels characteristic of the pre-pandemic economy. US producers tend to be the marginal suppliers of oil—entering when prices get too high and exiting when they get too low. But despite the recent surge in prices, US production has remained relatively muted. Oil producers have held back investment and production due to the increased risks of production in the pandemic environment (keep in mind that Omicron shaved 12% off oil prices in a matter of days). Coupled with lower production targets at OPEC+ and a surge in demand, oil prices have been rising throughout 2021. The good news is that rig count, a proxy for investment and future production, is continually increasing (though still well below pre-pandemic levels).
Although that is good news for short term energy prices, keep in mind that oil production and consumption remain environmentally toxic and major contributors to climate change. Recent electricity shortages in China and acute shortages of natural gas in Europe have increased global reliance on dirtier fuels, underscoring the need for greater green energy investment. The closures of nuclear reactors in Germany (alongside maintenance at several French reactors) are certainly not helping the situation, nor is the failure of a hydropower import referendum in Maine or the closure of nuclear reactors in New York.
Switching gears, ocean shipping and port throughput have been critical issues for the import-dependent US economy. According to data from Flexport, transport times on transpacific eastbound lines (China-to-US routes) have nearly tripled since late 2019 and remain near record highs. Relatively high transport costs are not deterring importers thanks to record demand levels, and a record number of ships are waiting outside the ports of Los Angeles and Long Beach. Omicron-induced staffing shortages, a massive surplus of empty containers stuck in the US, and a lack of excess capacity elsewhere in the US domestic transportation network have also contributed to the gumming up of west coast ports.
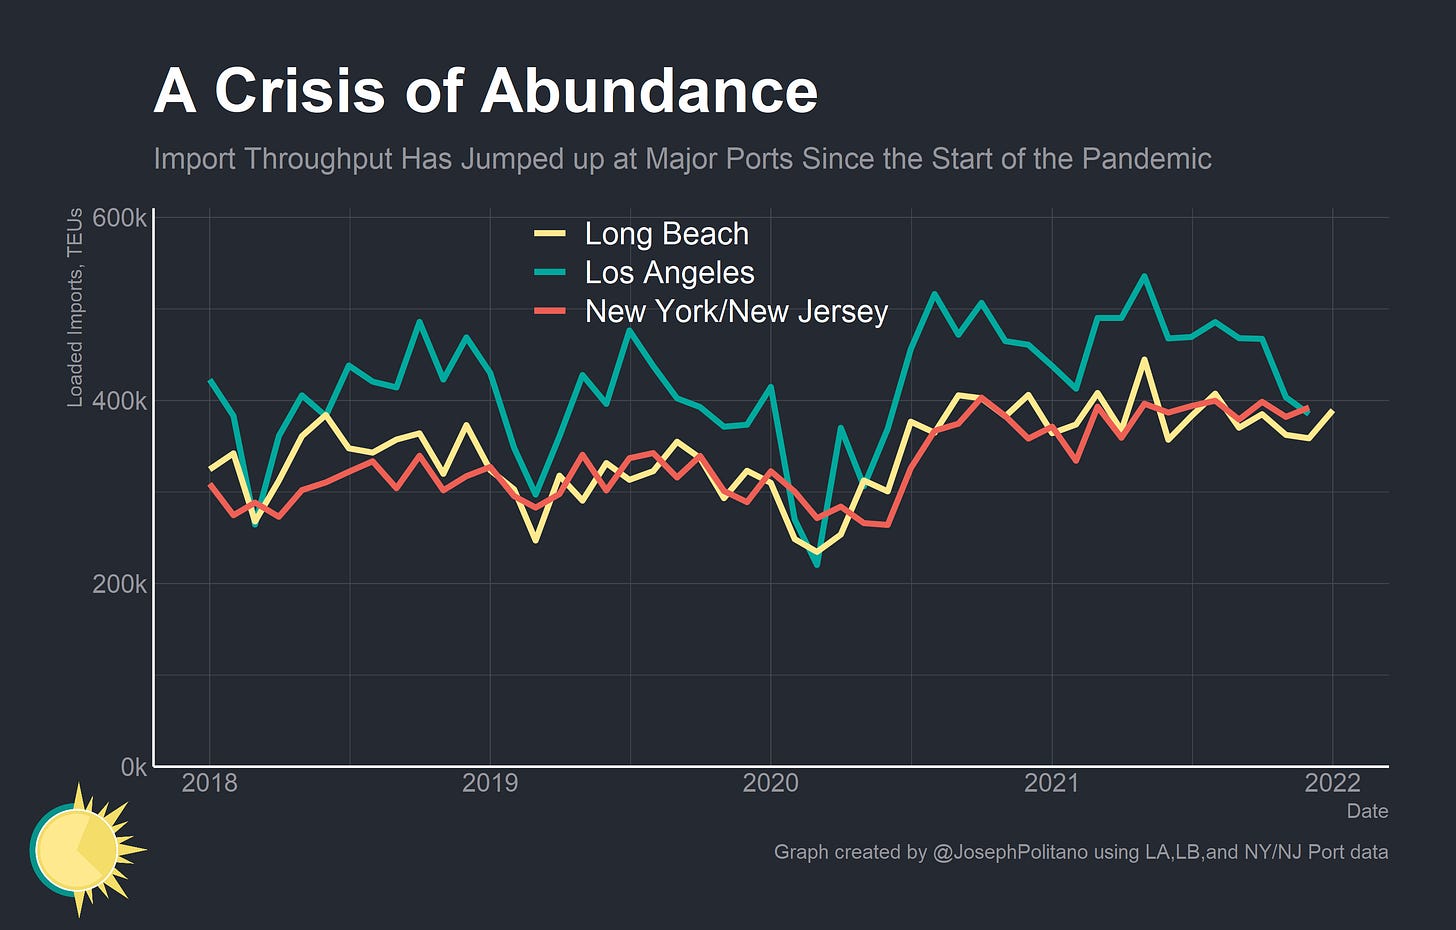
Still, it is worth remembering that major ports have been processing record import levels throughout late 2020 and all of 2021. In other words, this is a crisis of abundance—it is not that ports are struggling to maintain pre-pandemic activity levels like automakers, it is just that even with an increase in throughput they are unable to cope with the massive surge in demand. Recent stresses have pulled the import throughput at the Port of Los Angeles down, but other ports seem to be holding up well despite the Omicron variant. Given the size of the backlog, it is not likely that cargo shipping times will return to pre-pandemic levels in the near term, but forecasts for the medium and long term are more optimistic.
Conclusions
Finally, there are good reasons to expect the supply chain crisis to alleviate throughout 2022. The first is simply the unprecedented stress that supply chains are already under—it is hard to imagine things getting worse given how bad they already are. The second is the increasing resilience of producers to the pandemic. IHS Markit’s Global PMI survey shows a decreasing number of global factories reporting lower output due to material or staff shortages, a decreasing production deficit, and rosier future projections from firms.
Within the US, the number of firms reporting a shrinking order backlog increased marginally throughout 2022 and the number of firms reporting a rising backlog decreased significantly. As vaccinations continue and consumers’ cease spending such a disproportionate amount of money on goods, it is likely that backlogs will decrease further and eventually return to normal levels.
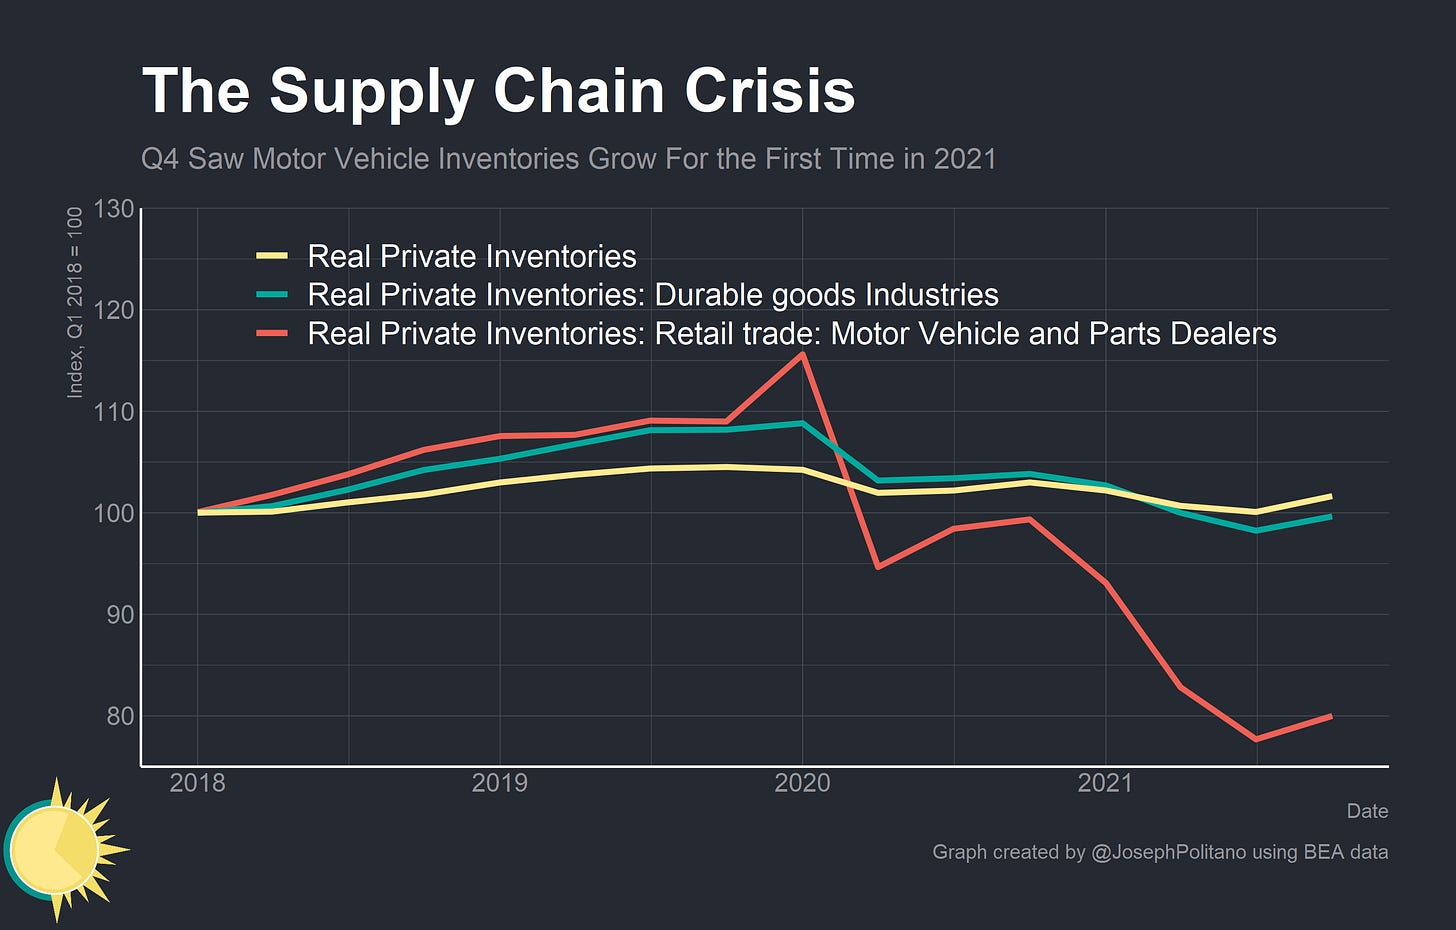
Finally, real inventories for durable goods and motor vehicles increased significantly in Q4 2021 for the first time since mid-2020. Part of this is higher prices stymieing demand, but part of it reflects real progress in satiating retailers and final customers’ high demand for goods. If production conditions continue to improve while goods demand shrinks, it is likely that durable goods prices will pull inflation downwards over the next few years. That will be important in getting inflation back to normal levels.
This change will be part of a critical change in the inflationary dynamics over the next year. While market-based measures of inflation expectations predict 3.6% growth in CPI over the next year, it is clear from recent CPI releases that inflation is becoming more broad-based and concentrated within the services sector. As always, this is why it is important to focus on nominal income and spending (which remain near normal levels) before drawing too many conclusions from headline inflation figures. The supply chain crisis should also serve the lesson that unforeseen shocks to the real economy can have disastrous consequences, and that the public health response to the pandemic has drastically affect prices and production. Countries like Japan, China, and Australia that have handled the virus better have seen far fewer supply chain disruptions during the last few years. Finally, it is always worth remembering that in a globalized system, the fortunes of all economies and industries are inextricably intertwined. Disruptions in one sector or country can have knock on effects throughout the rest of the world, and concentrated disruptions can have disastrous effects on the global economy.


Thanks for this analysis.
I would love to see an analysis of the change in CPI by sector.
For example, here in El Salvador and Guatemala (two Central American countries) we have inflation because of American inflation.
Salvadoran inflation (which is dollarized and more dependent on imports) is twice (6.5%) that of Guatemala (2.9%), and almost identical to America. However, it's exactly the same sectors those who have suffered the greatest price increase in both countries.
Checking out the CPI of these two countries shows clearly two sources of price increases:
- This whole supply chain issue is reflected on consumers through an increase in *retail furniture prices*, *food* (many of which is imported), and *restaurants*
- An increase in *gas prices* and in the *transport* sector.
(Sources: bcr.gob.sv and ine.gob.gt)
I find the sectoral breakdown to be quite illuminating.