Inflation hits 8.5%, Driven by a 18% Jump in Gas Prices
Under the Hood, However, the Data Looks More Encouraging
The views expressed in this blog are entirely my own and do not necessarily represent the views of the Bureau of Labor Statistics or the United States Government.
Thanks for reading. If you haven’t subscribed, please click the button below:
Otherwise, liking or sharing is the best way to support my work. Thank you!
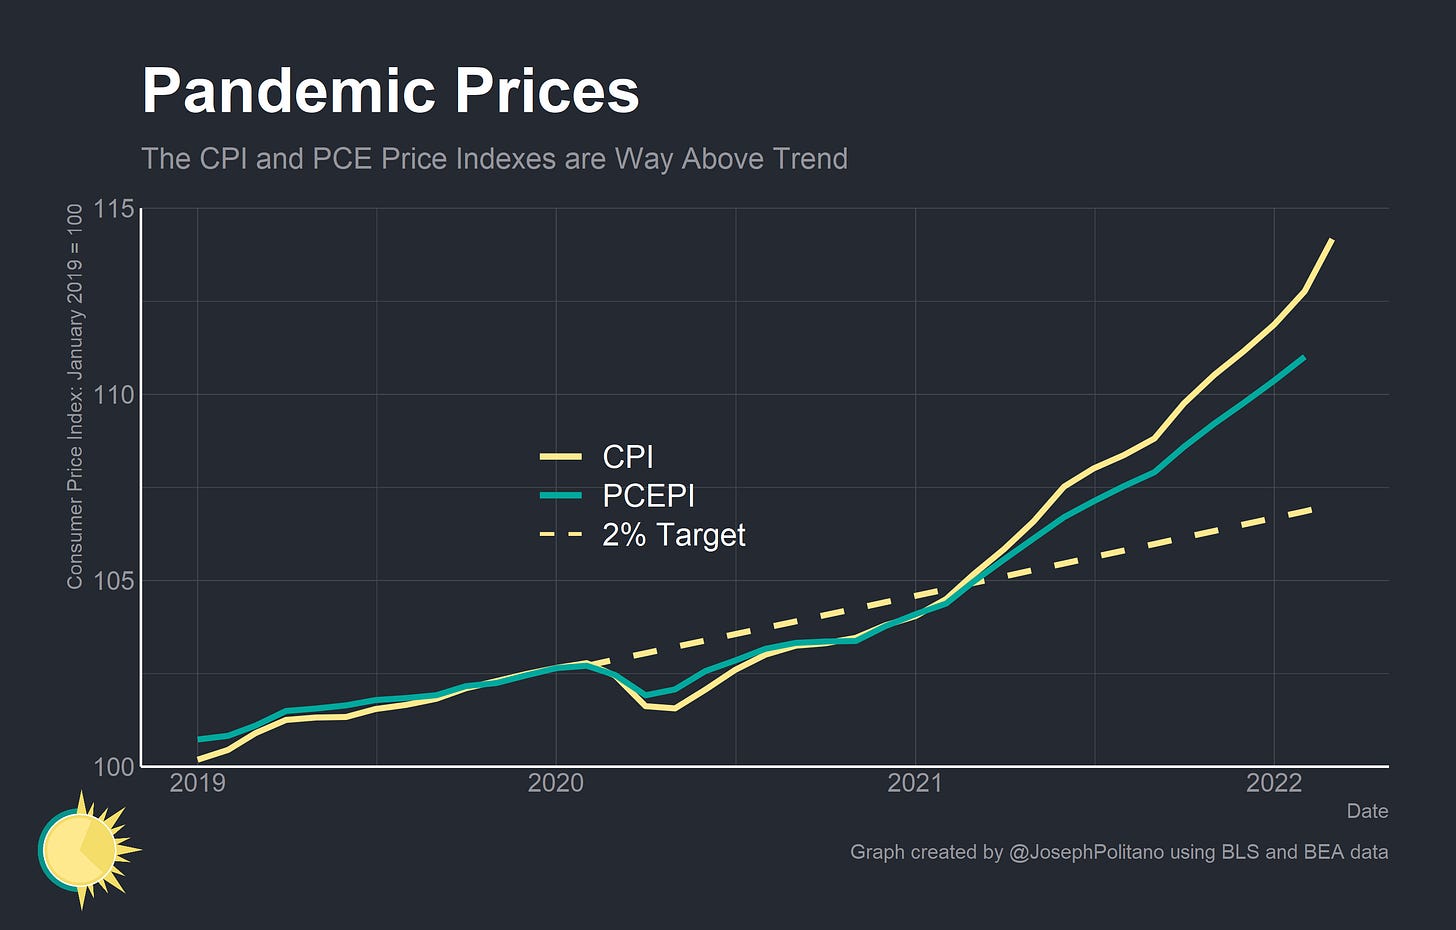
Inflation, as measured by the Consumer Price Index (CPI), was 8.5% over the last year—the highest since 1981. The monthly inflation rate was 1.2%—the highest since late 2005—driven mostly by a jump in gasoline prices. Under the hood, however, the data looks more encouraging; core CPI (which measures inflation excluding food and energy prices) increased by only 0.3% this month thanks to a drop in durable goods prices.
Last month, I wrote that the commodity price increases caused by the Russian invasion of Ukraine had not fully shown up in February’s CPI report. That shock has showed up significantly in this month’s report, with gas prices alone driving more than half the 1.2% monthly increase in the CPI. The good news is that there are reasons to be optimistic; gasoline price increases should abate, used vehicle prices declined significantly, and consumers continue to slowly renormalize their spending patterns.
Cash & Clunkers
Gas prices jumped 18.3% in March, the highest monthly increase since June 2009. Nominal gas prices are at their highest level ever, increasing nearly 50% over the last year alone. There are many reasons for this—an inability for the Organization of Petroleum Exporting Countries (OPEC) to hit its (lower than pre-pandemic) quotas, a push from domestic oil and gas shareholders to reign in production after years of unprofitability, and of course a drop in Russian exports of crude oil and natural gas. I plan on writing about this in more detail in an upcoming blog post, but suffice to say that price increases reflect a dearth of supply and strong global demand. The release of oil from the Strategic Petroleum Reserve will tamp down prices a bit, but the lockdowns throughout China are the most significant thing keeping global oil prices contained.
The significant jump in gas prices has belied a slowdown in core inflation. CPI less food and energy rose only 0.3% in March—higher than what would be consistent with normal inflation, but lower than at any point since September 2021. That’s thanks to the first drop in durable goods prices since January 2021 alongside a slowdown in housing price growth.
A 3.8% drop in prices for used cars and trucks was largely responsible for the drop in overall durable goods prices. This is a bigger drop than the Manheim used vehicle value index had suggested before the official data was released, and the first drop in used vehicle prices since mid 2021. Motor vehicles have been a significant contributor to inflation over the last two years, with total car prices pushing CPI up nearly 2% on their own. The fall in used vehicle prices should pull inflation down more in the upcoming months, especially as rising interest rates put pressure on consumers’ ability to finance larger auto loans.
The other factor to keep an eye on is an upcoming change to the Bureau of Labor Statistics’ (BLS) methodology for calculating prices for new vehicles. Starting with April’s CPI data released on May 11th, prices for new vehicles will be calculated using transaction data from JD Power. This will allow the BLS to directly cover a much larger chunk of all vehicle transactions in America and replace the surveys of car dealers that the agency did previously. That won’t change the CPI too much, however—the real change comes from how the BLS weighs different makes and models when calculating the different motor vehicle indices.
Essentially, in the old method relative weights were determined by the prior four years of consumer spending data, but in the new method the weights will be determined by the current and previous month’s spending. That too would not have had significant effects on how inflation is calculated—were it not for the pandemic and semiconductor shortage. Due to supply chain issues, automakers have focused on producing more higher-end new vehicles and sidelined some of the cheaper cars. Due to the vehicle shortage and shifts in consumer demand, these higher-end vehicles have also seen faster increases in prices. Were these methodological changes implemented before the pandemic, they would have resulted in a significant increase in measured prices for new vehicles. That doesn’t exactly mean that measured new car prices will now decrease by a larger amount—that depends on exactly how and when relative weights and prices change—but it is an important detail to keep an eye on when analyzing the price of new vehicles. Matt Klein has a (paywalled) post that goes into this in more detail, there is a short factsheet available online detailing all the changes, and the BLS has also published full technical documentation if you want more details on the upcoming changes.
Spotlight on Services
Returning to this month’s data, services prices are growing significantly as the economy reopens. Services less rent of shelter increased more than 5% over the last year, and the monthly growth rate was nearly 0.72%.
Monthly growth in shelter costs remains high, but rent costs in particular are not rising as quickly as last month. Month-to-month change in the shelter indices carries a lot of noise, but it is still an encouraging sign to see rental price growth cool. Keep in mind that CPI shelter prices tend to lag spot rents significantly as it takes time for new leases to be signed. Since tightening monetary policy primarily constrains inflation by slowing the pace of service price growth, it will be important to watch all service indices going forward.
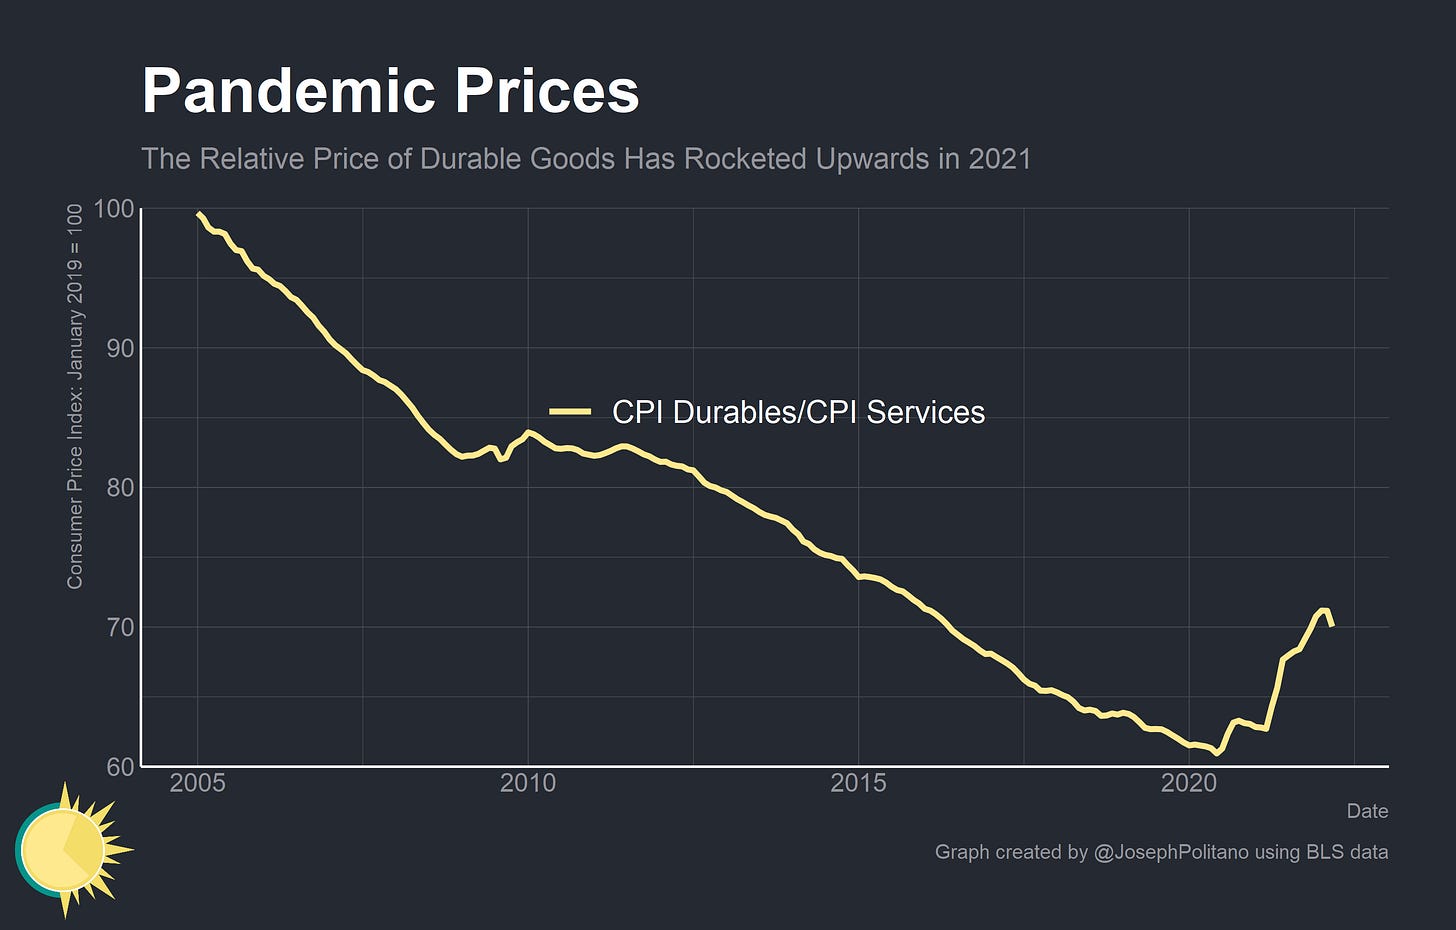
Finally, this month’s CPI release has seen the first major reversal of a trend that has dominated the pandemic economy: rising relative goods prices. As consumers shut themselves in they stopped consuming a wide range of in-person services. At the same time, they ordered record amounts of durable goods in order to make life at home more feasible and bearable. Combined with supply-chain bottlenecks, the result was a massive jump in durable goods prices (especially motor vehicles) and a slowdown in services prices—leading the relative price of durable goods to increase significantly for the first time in decades. With this month’s report, that trend has finally started to reverse.
That doesn’t mean consumer spending patterns have renormalized, however; Americans are still spending a disproportionate amount on goods relative to services. Still, aggregate goods spending has grown much less over the last year than aggregate services spending. All that to say that it will take time for relative spending on goods to return to normal levels, but the process is slowly underway.
Conclusions
Going forward, year-on-year core inflation should begin to slow down soon—even if month-on-month core inflation remains at elevated levels. Monthly core inflation was extremely high in April, May, and June of 2021, so the higher prices in those months will make year-on-year comparisons to April, May, and June of 2022 less extreme. In other words, base effects will begin to pull annual inflation down. The key question for month-to-month inflation will be how much declines in new and used vehicle prices will offset increases in rent and services prices.
Finally, growth in personal income was relatively strong in February, and personal outlays remain elevated as consumers spent down some of their excess savings. Still, this is not an inflationary environment characterized by extreme growth in nominal incomes and outlays as in the 1970s (when both were growing at a rate of nearly 10% per year). As long as nominal incomes are kept on-trend, inflation will abate and the economic recovery will continue.


"Service Prices Growth" is significantly affected by Transporation services such as airlines, Uber, subways and busses that are heavily affected by oil and fuel prices, though many people habitually equate services with labor costs. https://www.cato.org/blog/measurement-problems-service-prices-core-ppi-cpi-2
Hi Joey, thanks for that great article as usual. I just have a question regarding the following sentence: "Since tightening monetary policy primarily constrains inflation by slowing the pace of service price growth". Do you have any studies evidence for that?