The New Economic Geography of the Housing Shortage
How the Pandemic Accelerated Home Price Increases in America's Once-Affordable Areas
Thanks for reading! If you haven’t subscribed, please click the button below:
By subscribing you’ll join over 36,000 people who read Apricitas weekly!
America’s pandemic-era housing boom has seen prices rise 42% since the start of 2020, nearly matching the cumulative appreciation seen across the entirety of the prior decade. The increased importance of work-from-home led millions to put a hefty premium on living space, a lack of vacant inventory made supply issues more acute, and a resurgent labor market buoyed US household formation and spending power, all of which pushed up prices across the country. Home values even climbed another 1.75% over the last year, setting new records despite mortgage rates having risen to the highest levels since the turn of the millennium. Yet housing market dynamics don’t just happen uniformly across the nation—rather, they play out through thousands of interconnected local and regional housing markets, many of which have been changed drastically in the last four years.
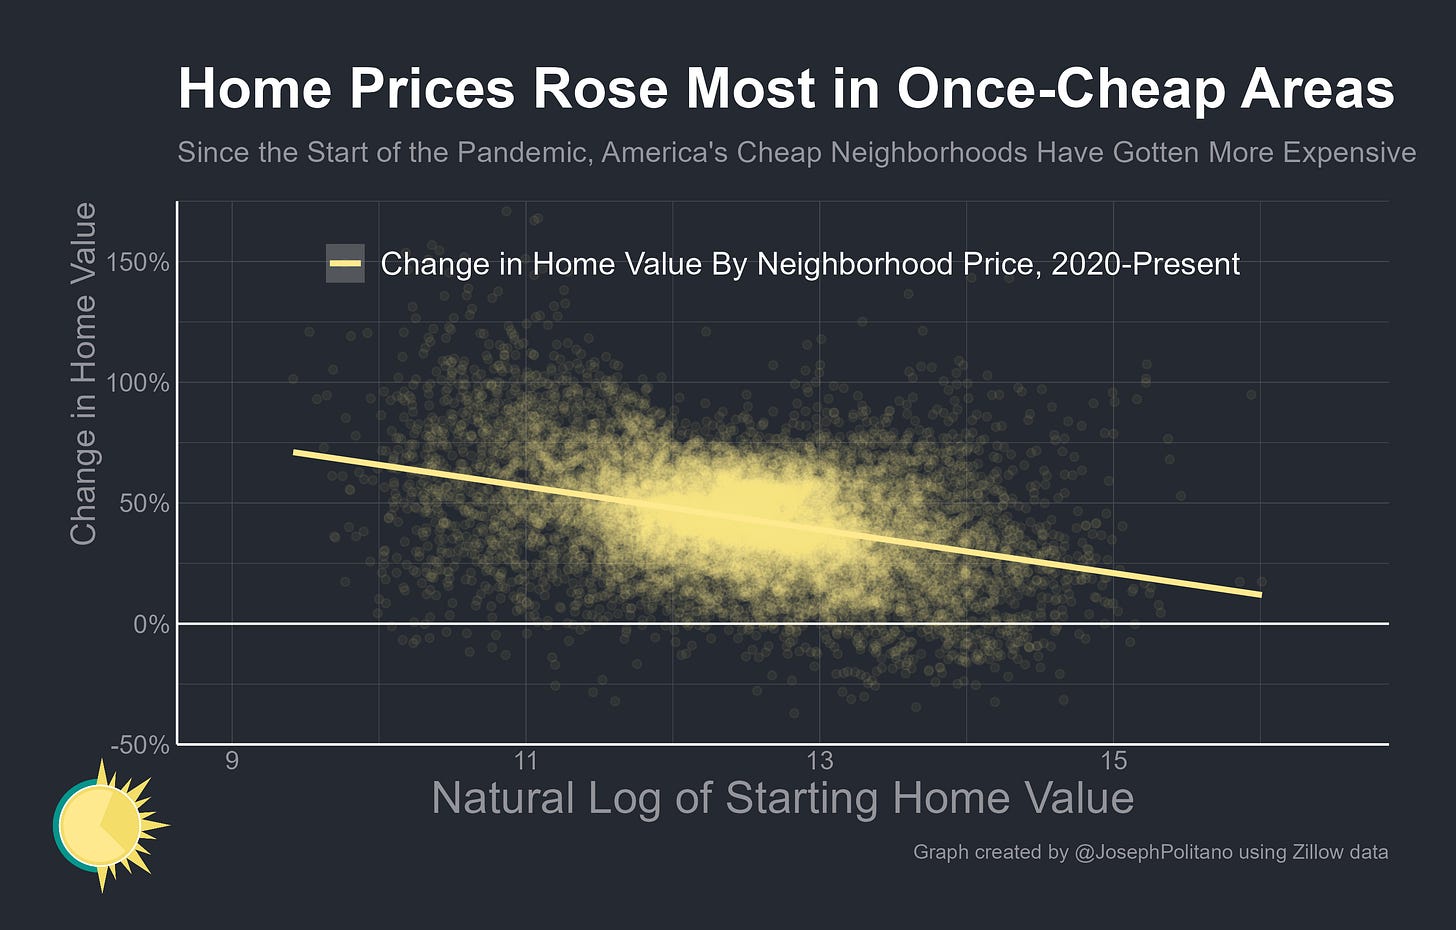
Indeed, when you break down the national data to a neighborhood level, an interesting overall pattern emerges—America’s cheapest areas have tended to see the fastest home price appreciation since 2020, something that was pointed out by Adam Ozimek, Chief Economist at the think-tank Economic Innovation Group (keep in mind that this graph is using a log scale, so linear movements along the X axis represent exponential increases in neighborhood price). This is the “donut effect” in action—the rise in remote work has meant expensive neighborhoods in the downtown of urban cores have seen prices grow by much less than cheaper suburban neighborhoods on the outskirts of cities, producing the ring-shaped maps of home price growth and household migration from which the effect gets its name.
Or is it? Looking back at the four-year period before the pandemic, the same pattern emerges—America’s lower-priced neighborhoods saw faster home appreciation than their higher-priced counterparts, well before the remote work revolution. This isn’t simply a timeless truth of the US economy either—the same analysis on pre-Great Recession home appreciation shows the opposite pattern, where prices in high-cost neighborhoods grew faster than prices in low-cost neighborhoods. What’s going on?
When I originally saw Ozimek’s analysis, the first thing it reminded me of was a similar paper written by Kevin Erdmann just over a year ago on American housing market dynamics. The short version of Erdmann’s thesis is that rising rents are the underlying driver of rising home prices, the lack of housing construction throughout the last decade-and-a-half has caused rents to surge, and the shortage of housing has caused extremely intense competition for limited affordable housing units at the bottom of the price spectrum. That intense competition has manifested as disproportionately high rent increases in once-cheap neighborhoods, rising price-to-rent ratios, increasing shares of low-income households’ spending going to housing costs, and domestic outmigration from expensive metro areas among the middle/working class—the telltale signs of gentrification and displacement.
Indeed, when you look at the distribution of American housing prices at the ZIP code level, this pattern of vanishing affordability becomes clear. The price distribution has generally shifted rightward, reflecting inflation and broad home appreciation, but it has also flattened significantly as more and more affordable and midrange areas move into expensive territory.
Within-neighborhood price appreciation reflects much of the same dynamics, with the bottom tier of American homes—that is, the lowest-priced subset of units within a given area—having appreciated fastest since roughly the mid-2010s. Cumulatively, top-tier home prices have increased by 36% since the start of the pandemic while bottom-tier prices have increased by 44%.
So if price spikes in once-affordable areas are an underlying long-term dynamic of fading affordability caused by the housing shortage, what has actually changed in the pandemic era? Well, the donut effect is definitely still real and readily visible, but it is not the only geographic phenomenon at play—the pandemic has interacted with the housing shortage in multiple ways that led to shifting effects both within and across metro areas:
Higher-income remote/hybrid workers can now more easily move farther out of city centers in search of affordable housing (this is essentially the main driver behind the donut effect)
Higher-income remote workers can also much more easily move to other metro areas where housing is more affordable
Lower-income workers can more easily move to other metros where housing is more affordable thanks to the stronger labor market
The cumulative effect of these factors varies heavily from place to place, but the main difference is that searching for affordable housing became somewhat more of a cross-metro and somewhat less of a within-metro phenomenon. To illustrate what I mean, look at two major cities with diametrically opposing situations: San Francisco and Dallas.
San Francisco is the quintessential artificially-supply-constrained housing market, with surging prices and extremely low construction levels throughout the 2010s. Pre-pandemic, it was America’s second-most-expensive metro area, falling just behind its neighbor San Jose, and it exhibited a common case of vanishing affordability as what remained of the “low-price” areas saw disproportionately massive home appreciation. This partly reflected the ongoing gentrification of urban SF, but it also included the trend of workers moving farther and farther away from downtown job centers and into the suburbs in search of more affordable housing.
Since the pandemic, the story has been somewhat different—prices are still up 20.6%, about even with the 22.4% appreciation seen in the prior 4 years, but the distribution has completely changed. Instead of home prices at the bottom end surging and stagnating at the top end, appreciation has been relatively evenly spread throughout. Remote work has enabled many once-SF employees to decamp for more affordable pastures elsewhere in America, and that drove down metro area prices, but it also alleviated the specific pressure on SF’s lowest-priced neighborhoods—many people who would have been moving there were instead moving to cheaper homes in Texas.
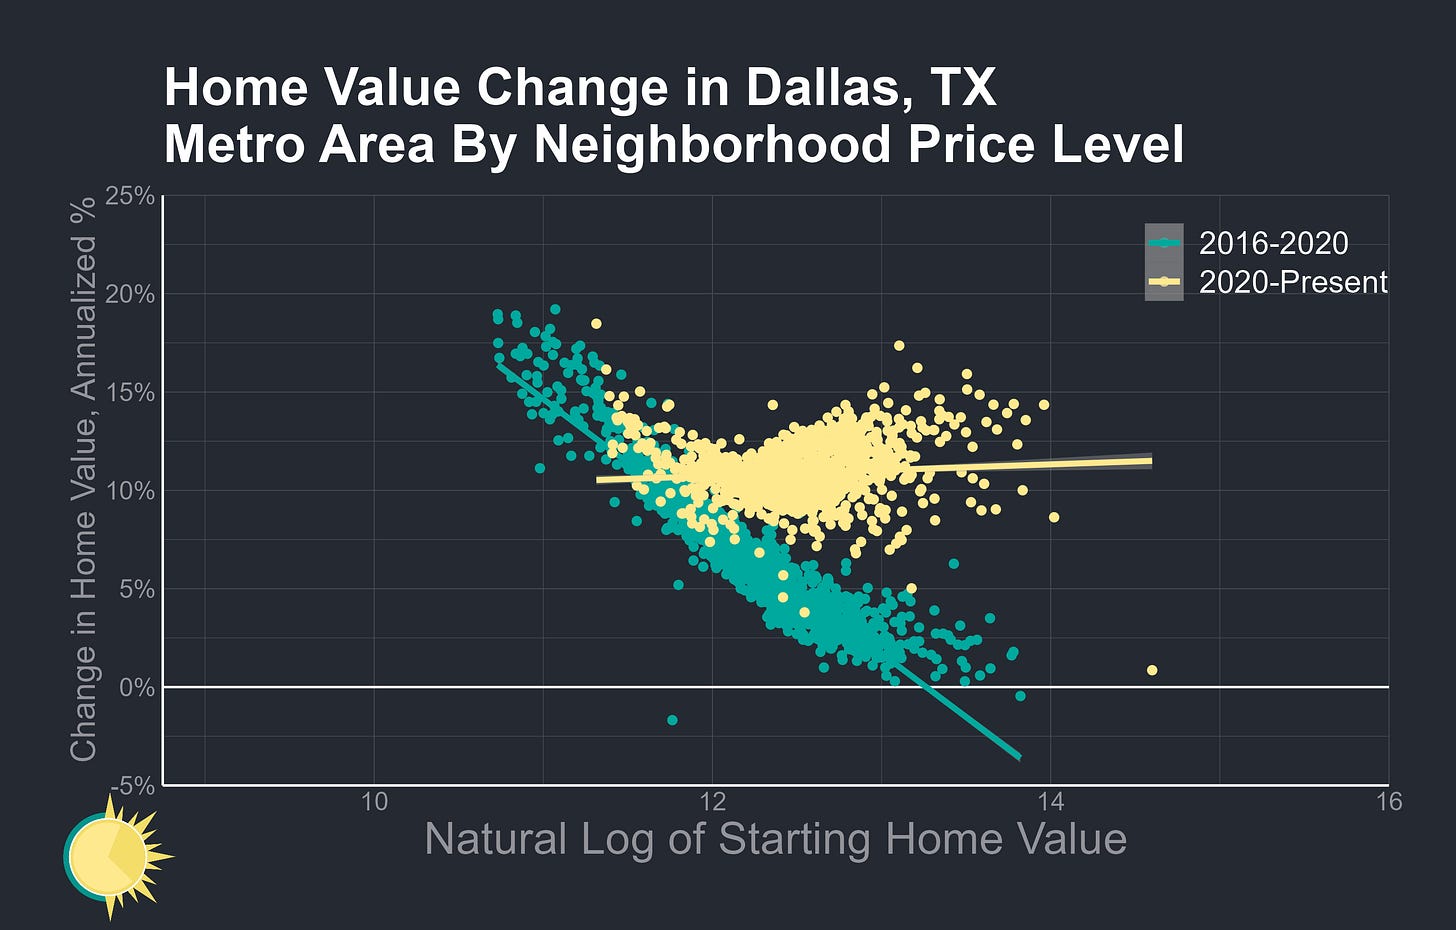
On that note, let’s look at Dallas on the opposite end of the spectrum from SF—last year, it added more new residents than any other metro area in America thanks to its comparative affordability and high construction activity. Pre-pandemic, its home appreciation had an even more pronounced slope, with many low-cost neighborhoods skyrocketing in value and high-cost neighborhoods barely increasing at all. A lot of new housing supply was coming online in the area, but it was still just not enough to keep up with economic growth and make up for construction shortfalls occurring elsewhere in the country.
Since the pandemic, the curve of price gains in the Dallas area has shifted dramatically, almost as if it had been bent horizontally—the middle and high-tier neighborhoods skyrocketed in value while the remaining cheaper neighborhoods mostly held onto their elevated pre-2020 growth rates. How did this happen? In part, because of the surge in across-metro migration—mid and even high-priced neighborhoods in Dallas were still cheap by the standards of most Angelenos or Seattleites, and remote work enabled them to move eastward. That drove up metro-wide demand and essentially subjected the upper ends of the Dallas-area price spectrum to the same kind of aggressive buying competition that had previously only plagued the region's lower-priced neighborhoods.
Every city falls somewhere on this spectrum—as the tension between shocks to within-metro migration and across-metro migration caused by the pandemic has shifted the form and size of neighborhood-level price changes in unique ways across the country.


