The New Geography of American Growth
How the Pandemic has Reshaped US Economic Growth—Leading to Booms in Florida, Texas, and throughout the American South and Mountain West
Thanks for reading! If you haven’t subscribed, please click the button below:
By subscribing you’ll join over 38,000 people who read Apricitas weekly!
Nearly four years since the start of COVID, almost every single state has now seen its economic output finally exceed pre-pandemic levels—and the few remaining stragglers are mostly small states dominated by struggling local industries (oil and gas in North Dakota/Louisiana, tourism in Hawaii, and finance in Delaware). Yet the geography of American economic growth has radically changed since 2020 as the pandemic accelerated many existing trends—and spawned several new ones.
Idaho and the other “mountain lions”—including Washington, Utah, and Arizona—have boomed thanks to remote-work-driven population influxes from California and other expensive states. The Golden State itself has recovered thanks to an early-COVID boom across its tech sector, but is now steadily losing population for the first time in decades. Meanwhile, Northeastern states outside of New England have had a sluggish recovery as New York, Pennsylvania, and Connecticut all trail well behind the nationwide average GDP growth and major Midwestern states like Illinois and Wisconsin have had even slower growth.
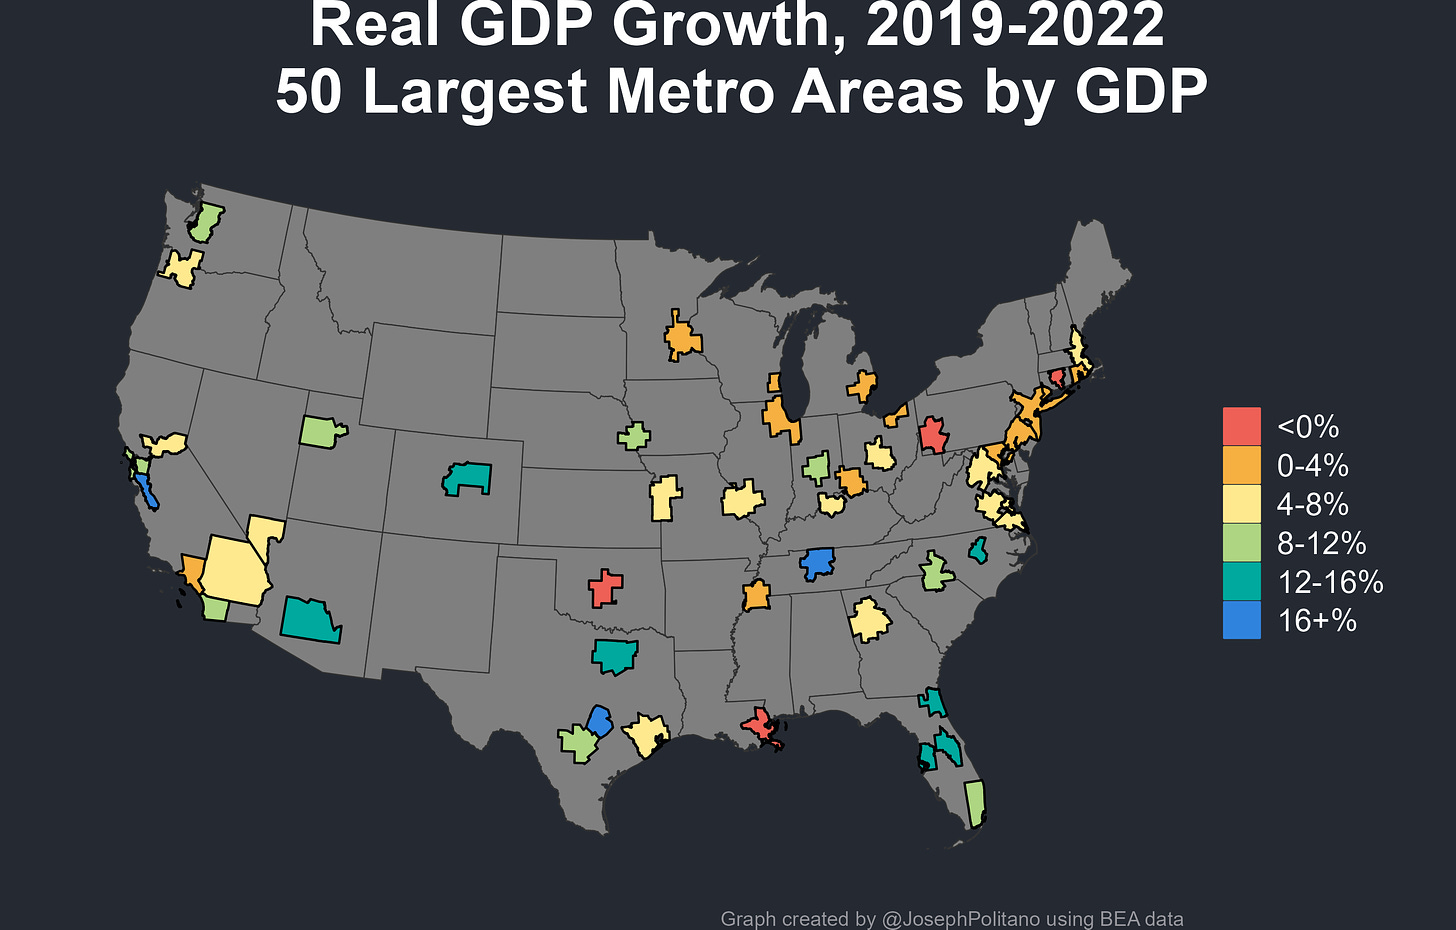
Yet the largest shift has certainly been the widespread boom across the American South—including Tennessee, Arkansas, North and South Carolina, Florida, and of course Texas—as long-term southward domestic migration patterns got supercharged by remote work and a construction boom has engrossed most of the sunbelt. Florida has become the fastest-growing state in the union, with its GDP increasing nearly 19% since Q3 2019—while The Villages, anchored around a retirement community in central Florida, was America’s fastest-growing Metropolitan Statistical Area (MSA, a city and its surrounding economic region) with GDP increasing 27.6% over the last three years. Meanwhile, Texas’ growth has been among the most impressive given its size—its real economic output has increased by $230B over the last four years, putting it just barely behind California as the second-largest contributor to nationwide growth despite Texas’ economy ending 2019 30% smaller than California’s.
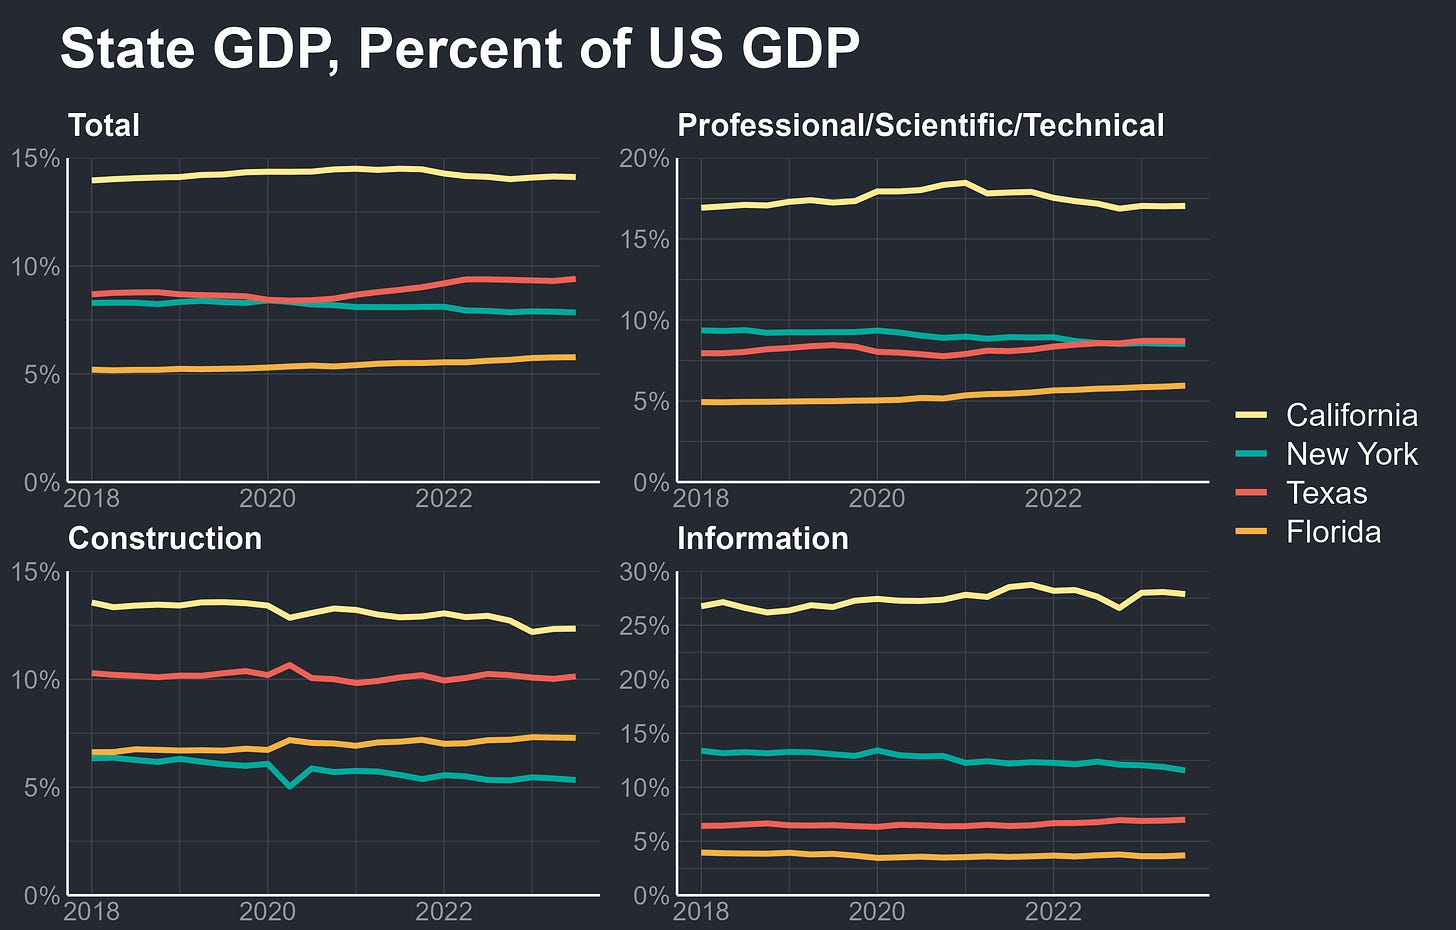
That impressive growth has allowed Texas to pull ahead of NY in overall GDP and in white-collar professional, scientific, and technical services output over the last four years. Indeed, while Florida and Texas have gained ground since the start of the pandemic, New York’s lagging growth means the Empire State is currently a declining share of the overall national output. California’s economy has also fallen slightly as a share of overall US GDP, especially in 2022 as the state’s tech industry contracted. In the information sector—mostly representing those tech companies—the Golden State still dominates but New York has steadily lost ground and has seen its comfortable second-place lead dwindle. However, arguably the most important has been the shift in construction activity—New York and California are infamous for their heavy restrictions on building, especially compared to Texas and Florida, and they have both seen substantial declines in their share of nationwide construction output. In 2022, Florida permitted 9.5 new units per thousand residents and Texas permitted 8.8—while the equivalent figures were 2.1 in New York and 3.1 in California. The gap is so large that each of the Dallas, Houston, and Austin MSAs permitted more new units than the entirety of New York State last year, with Dallas alone beating NY by 80%.
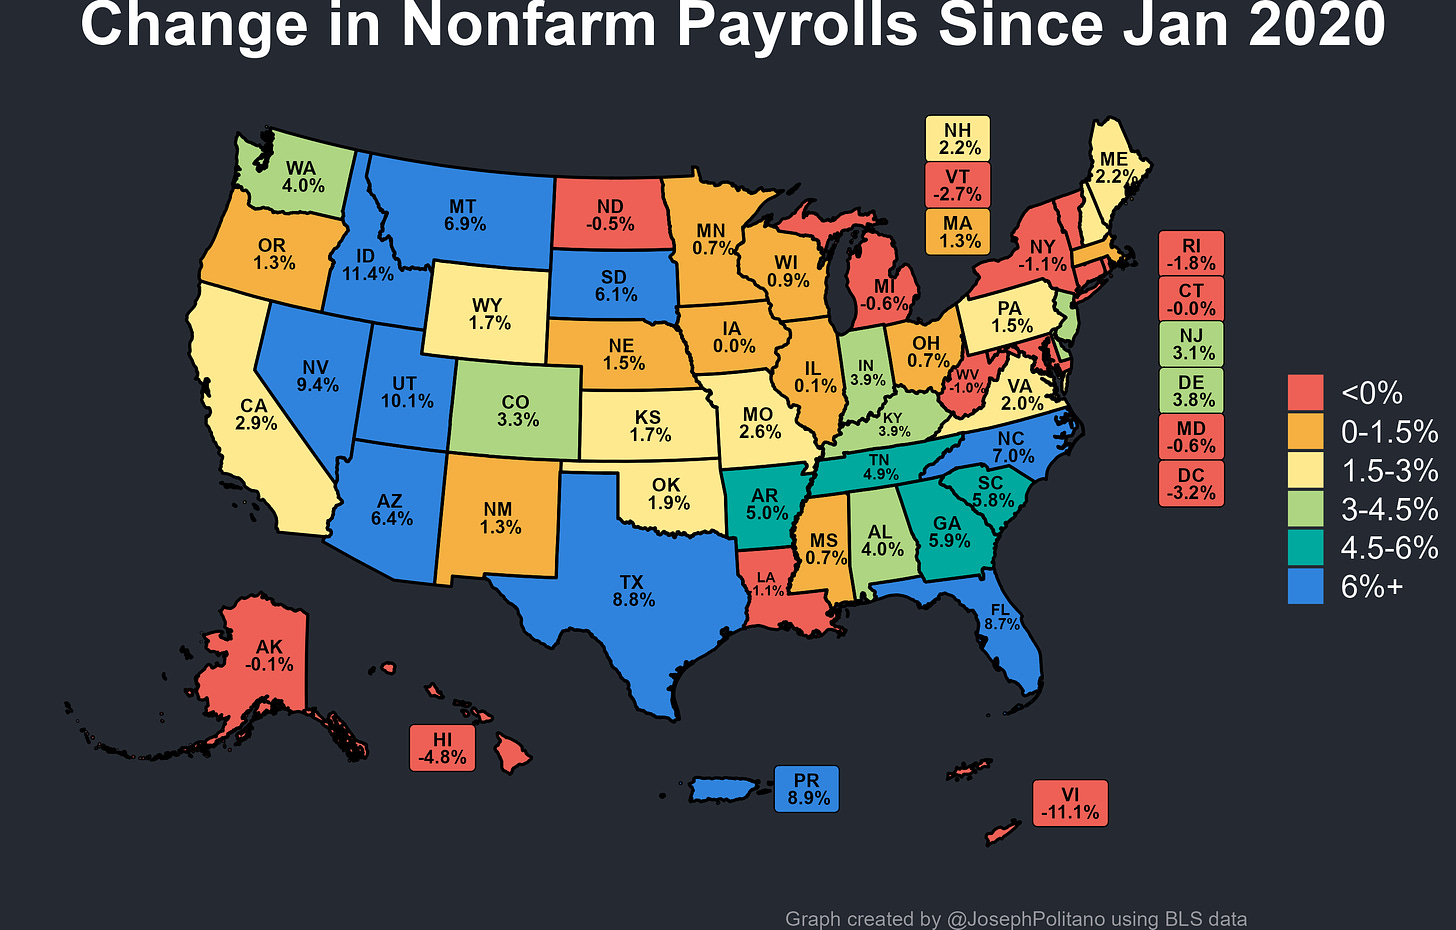
When looking at job growth, the trend becomes even more stark—most states have now recovered all their lost jobs but several key states continue to struggle. In the Northeast, New York is still down more than 100,000 jobs since 2020, meaning its payroll count has fallen below Florida’s for the first time, alongside drops in Connecticut, Rhode Island, Maryland, and DC. In the Midwest, Michigan remains more than 25,000 jobs away from a full recovery, while Illinois, Ohio, Wisconsin, and Minnesota all have only meager net job growth. Nationwide payroll gains over the last four years have been 3.3%, meaning even California is lagging behind the rest of the country after comfortably leading the US throughout most of the 2010s. Meanwhile, hiring has surged in other rocky mountain and southern states with payrolls in North Carolina, Arizona, Nevada, Utah, Idaho, and Montana all increasing by more than 6%. Most impressive has been the 8.7% growth in Florida and 8.8% growth in Texas, making the two states far and away the largest contributors to overall nationwide job gains.
In fact, job growth in Florida and Texas has been so large that one in three new jobs in America come from those two states, and more than one in five come from Texas alone. This was in large part thanks to a white-collar boom —In the Lone Star state, more than 300k new jobs came from professional & business services and another 100k came from financial services, with the equivalent figures standing at nearly 250k and 85k in the Sunshine state. Compared to just before COVID, aggregate employee compensation is up 35% in Florida and 29% in Texas, making them some of the fastest growers and largest contributors to overall wage gains in the union. Yet even within booming states, important regional dynamics have emerged through the economic shocks of the last four years.
Looking Beyond the State-Level
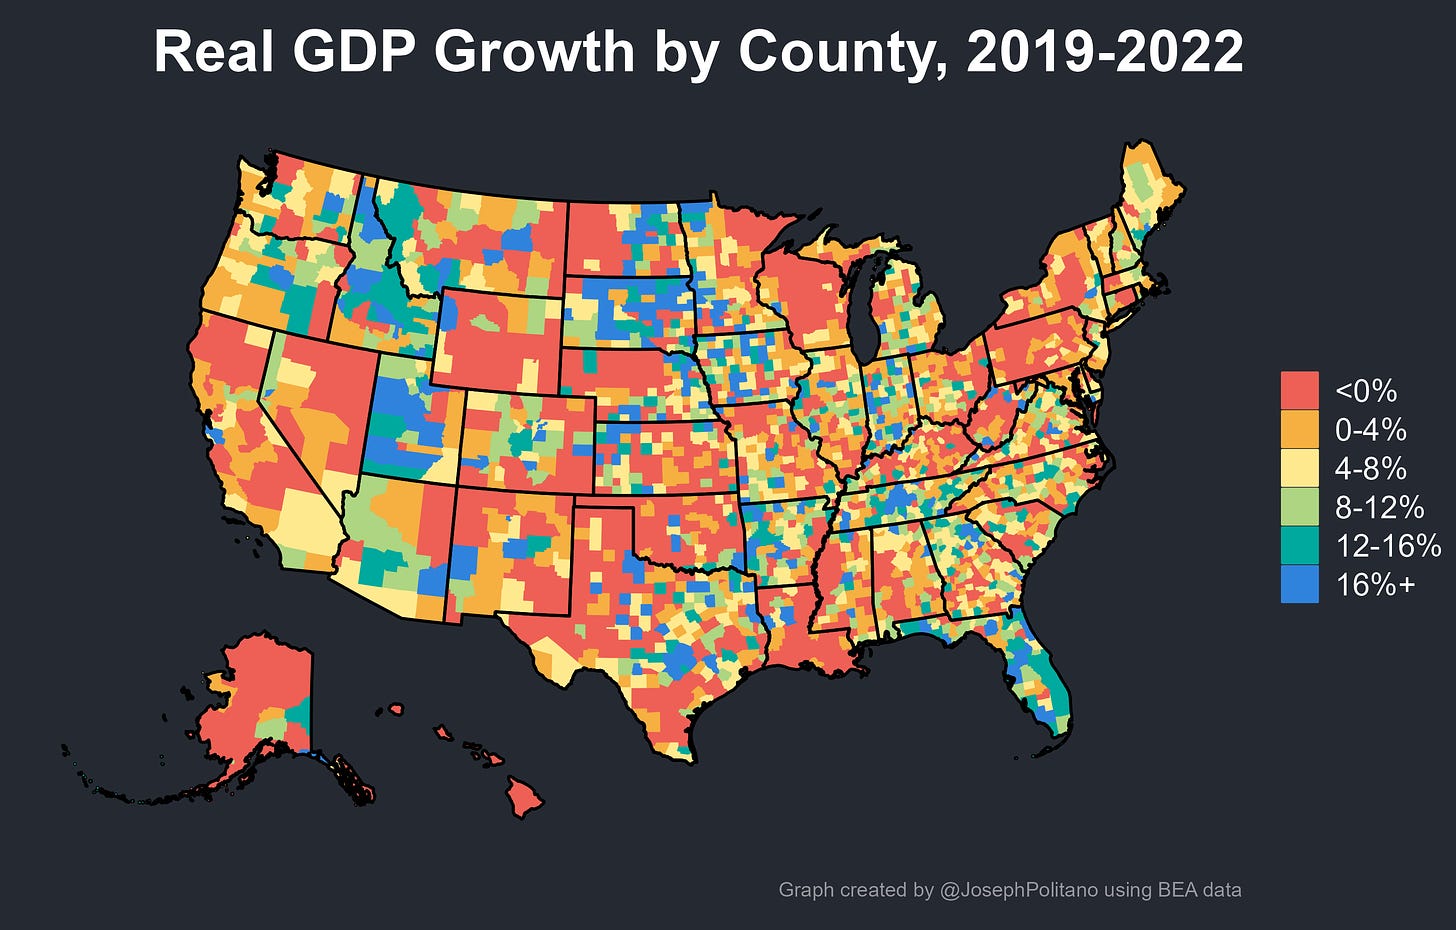
To examine this, we can dig another level deeper and look at the county GDP growth rates throughout the United States. Doing so, it becomes readily apparent how widespread growth has been throughout Florida, Utah, and Idaho—plus how strong growth has been throughout the regions around Austin, Nashville, Atlanta, and the Bay Area. It also becomes clear how much growth has spread out over the last three years, as places like New Jersey, Northern Virginia, Southern Maine, and more benefit from remote-work-driven shifts outside of major urban cores.
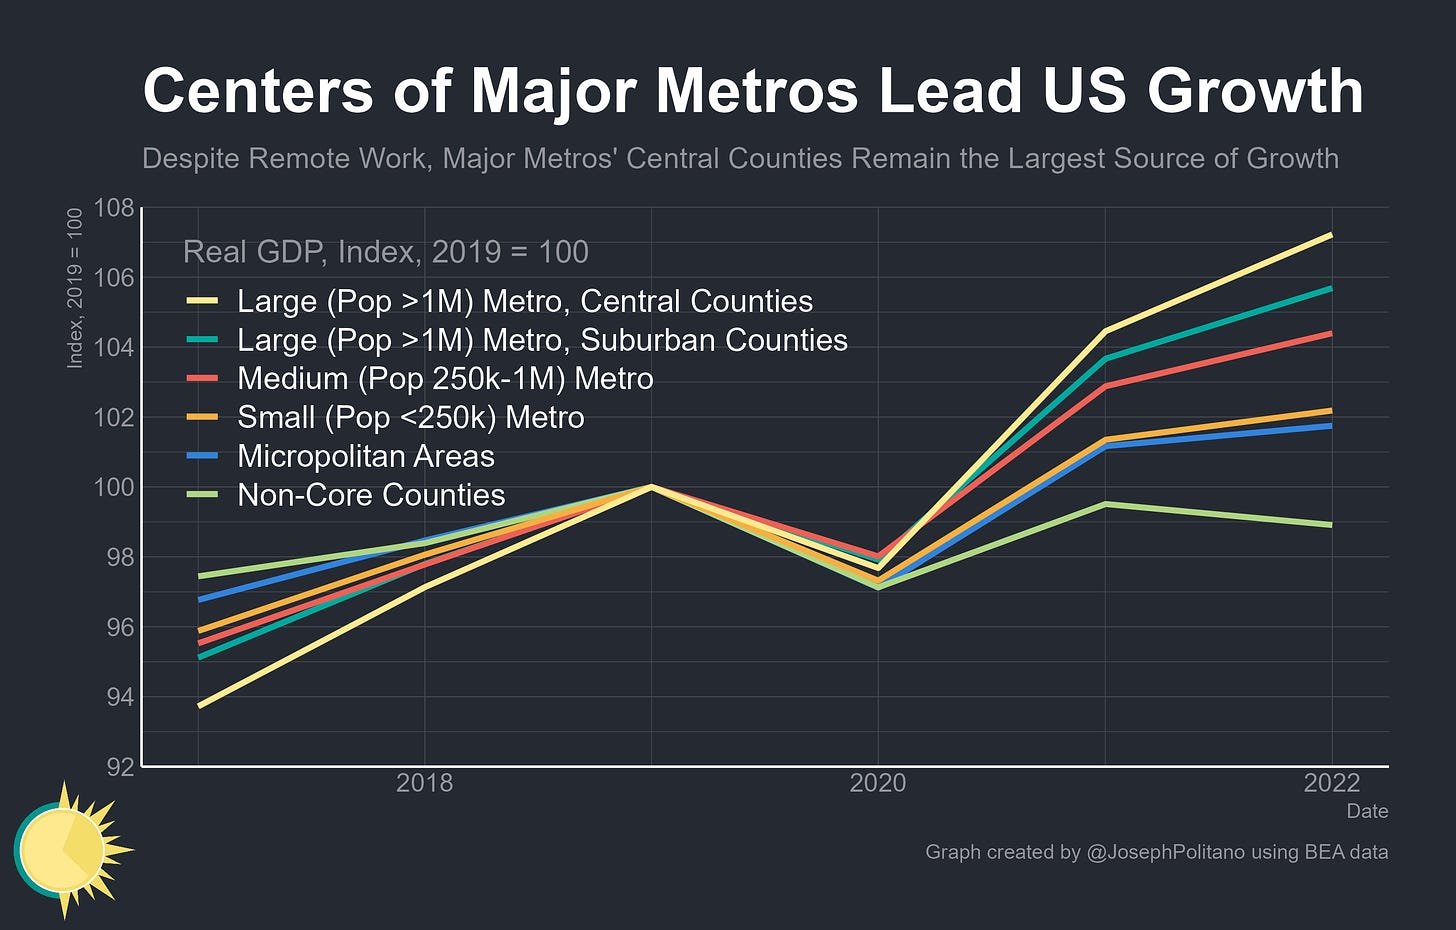
Still, despite the rise of remote work, America’s large urbanized areas have actually led the economic recovery of the last few years. These counties—which include Manhattan, San Francisco, and DC but also places like Dallas, Texas and Maricopa, Arizona—were hit harder by the initial impacts of COVID but have more than recovered and are beating the national average growth rate. Suburban counties of these major cities are, perhaps unsurprisingly, growing faster than in the years before the pandemic, but they still trail their central counterparts. Meanwhile, medium-sized metros have gotten very little boost in growth from the pandemic—while small metros, micropolitan areas, and non-core rural counties have lagged behind.
The continued importance of urban cores can be seen more clearly when looking at the size of growth rather than the rate of growth across US counties—counties at the center of major metro areas throughout the South and West have contributed the most to overall US GDP growth while some of the fastest growers in booming Idaho and Utah regions have contributed relatively little simply because they remain so small. Rapid expansion in the tech industry throughout 2020 and 2021 means much of net post-2019 US growth still comes from the Bay Area and Seattle, with Phoenix and southern California rounding out the largest contributors in the broader Western US. Florida’s growth was relatively widespread throughout the state but still strongest in Miami, Tampa, and Orlando—as Davidson County (Nashville), Mecklenburg (Charlotte), Wake (Raleigh), and the broader Atlanta area rounded out the rest of growth in the South.
Texas’s boom is perhaps most emblematic of the shifts since the pandemic—growth has been large but heavily concentrated between Austin, Dallas, and Houston, and within this triangle, it’s the principal counties of these three metro areas that have grown the most. That’s particularly important in light of within-Texas population shifts—Dallas, Travis (Austin), and Harris (Houston) counties are all seeing slower population growth than their surrounding suburbs, yet they continue to anchor their metro area’s economic growth. Remote work has thus dramatically shifted GDP between regions to the benefit of states like Texas and has enabled substantial migration out of cities in search of more affordable housing arrangements, but it has not changed the fact that suburbs remain well in the economic orbit of their principal cities.
In other words, much of the changes in economic geography brought about by the pandemic reflect shifts in growth dynamics between metro areas, not within them. And those changes have been substantial—the Dallas metro area, despite being less than 1/3 the size of the New York metro, has contributed more to nationwide economic growth over the last three years than any other. Miami alone has contributed more to nationwide growth than the four largest midwestern metros combined, and Austin was likewise the fastest grower among America’s 100 largest metros. Those areas roundly beat out some of the “superstar cities” that led growth throughout the 2010s—as the NYC and LA metros in particular have had a very weak recovery from the pandemic. That begs the question—how much of America’s changing economic geography is a one-time shift caused by the shock of the pandemic, and how much of it represents a durable change in economic trends?
Keep reading with a 7-day free trial
Subscribe to Apricitas Economics to keep reading this post and get 7 days of free access to the full post archives.


