
America is Flying Blind on Immigration
Nobody Knows How Many Immigrant Workers Have Left the US Amidst Trump's Mass Deportations. That's Incredibly Bad.

Thanks for reading! If you haven’t subscribed, please click the button below:
By subscribing, you’ll join over 75,000 people who read Apricitas!

Today, roughly one-in-five American workers are immigrants. They contribute massively to the US economy in sectors as wide-ranging as healthcare, construction, education, agriculture, finance, manufacturing, and tech. That means the question “How many people have immigrated to the US this year?” is increasingly important to the American economy, making it all the worse that we currently have no good answer.
In a country like Canada, the vast majority of immigrants come via airports or the few land border crossings with the United States, making it comparatively easy to produce quarterly inflow statistics. The national census is done every five years, ensuring immigration counts are benchmarked to comprehensive data more frequently. Plus, the Canadian government maintains a series of specialized surveys dedicated explicitly to tracking immigrants’ education, labor market, housing, and other outcomes. US immigration statistics are comparatively sparse, with aggregate population estimates only produced once per year and comprehensive censuses only done once a decade.
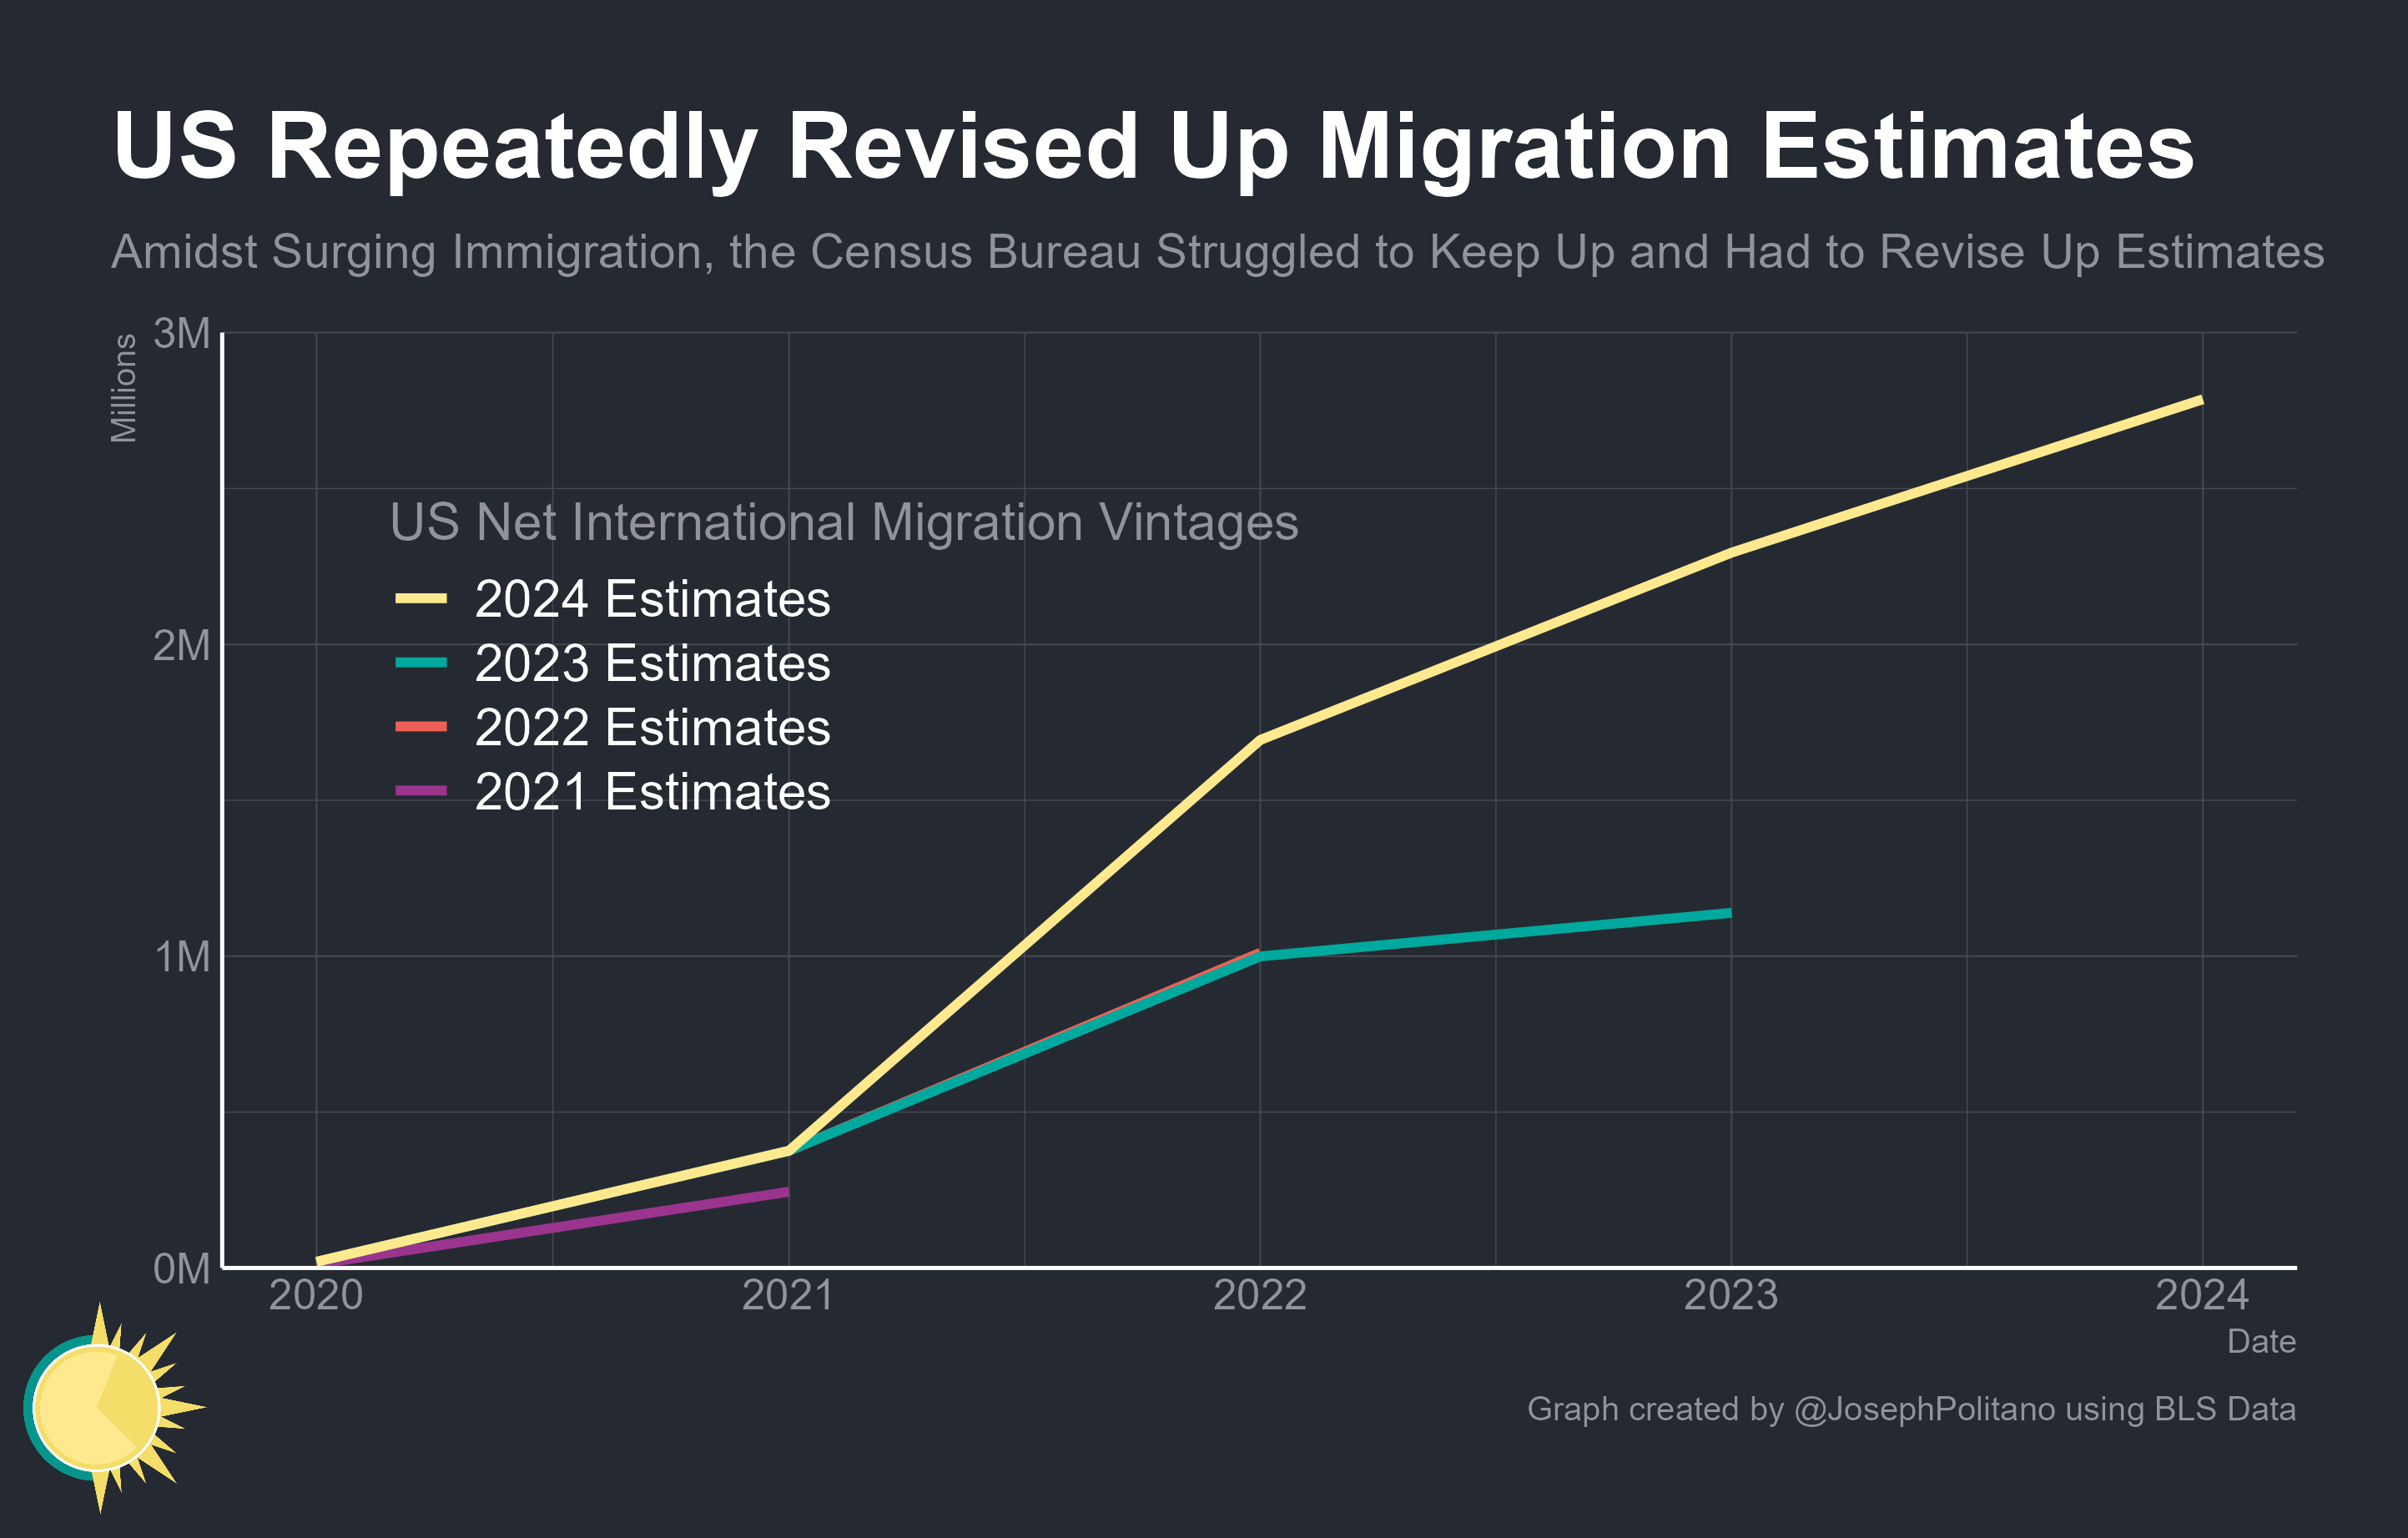
Previously, this wasn’t much of a problem—America is a much larger country with a much lower immigration rate than Canada, and population flows tended to be stable enough that shifts in immigration policy were not macroeconomically significant. That changed during the pandemic, as COVID-related travel restrictions caused an unprecedented slowdown in immigration flows at a time when regular data collection was extremely difficult. Immigration subsequently rebounded to the highest level in decades, but that 2021-2023 immigration surge did not show up in official data for years because so many of the immigrants went through asylum or refugee systems that were not well-tracked by population statistics.

Now, the same problem is happening in the opposite direction—the Trump administration’s crackdown on immigration is not well-tracked by public statistics, so it is totally unknown how many fewer immigrants have moved to the US this year or how many residents have actually been deported. The last official population estimate was released before the Trump administration began stripping many immigrants of legal status, deliberately shrinking legal immigration flows, and implementing mass deportations of undocumented immigrants. Answering simple questions like “what is a normal amount of job growth, given the immigration downturn” is now so difficult that forecasters and think-tanks are coming up with wildly different answers.

Even answering how many immigrants have left the United States amidst ICE crackdowns is functionally impossible. The US Department of Homeland Security claims that “two million illegal aliens have been removed or self-deported since January 20th,” but these estimates come entirely from the Current Population Survey (CPS) data used to calculate national unemployment statistics and are fundamentally inconsistent with other official data sources. Indeed, because the CPS data has a comparatively small sample and is extremely vulnerable to shifting response rates, the Census Bureau itself explicitly cautions against this kind of use “when other data are available.” The problem is that, for the moment, we have no better data sources to rely on. America is left flying blind.
The Challenge of Immigration Data Collection
Imagine you are regularly surveying a small town of 1,000 people. Every month, you randomly knock on 100 neighbors’ houses and ask them if they are unemployed. Usually, you get roughly 50 men and 50 women to answer, because the town is half women and half men. Yet some months, by pure chance, you end up with 60 men and 40 women or vice versa. If men are structurally more likely to be unemployed than women, a monthly sample with more men than women will make it misleadingly appear as though unemployment is rising! What should you do about this?
To mitigate this effect, official US jobs data deploys population weighting. To oversimplify, instead of taking the raw unemployment rate in a sample of 60 men and 40 women, they would instead measure the unemployment rate for men and women separately and then weigh them each by half. The Current Population Survey (CPS), which measures US unemployment, deploys population weights for age, race, sex, and Hispanic ethnicity, but not for immigration status.
Returning to our small town example, imagine that 40% of the population is Hispanic. Half of the Hispanic population are immigrants, so immigrants make up 20% of the town’s total population. If a sample randomly comes back 20 Hispanic, 10 immigrant, and 80 non-Hispanic, this will be corrected by population weighting to instead match the real demographics of the town. It’s important to note that even though the immigrant share of the population was not directly controlled for, controlling for Hispanic ethnicity indirectly corrected for the undercounting of immigrants in this case.
Now imagine the government announces a major crackdown on immigration. Border controls are increased to reduce undocumented immigration, laws are rewritten to reduce documented immigration, legal status is stripped from large numbers of existing immigrants, and interior enforcement is amped up to increase deportations. Some immigrants leave your town and some of those who remain become fearful that you will refer them to other parts of the government for harassment or deportation if they disclose their immigration status. The town now has a lower population, immigrants have become less likely to answer your surveys, and those who do answer are more likely to lie about their citizenship status.
Samples start regularly coming back 10 Hispanic, 5 immigrant, and 90 non-Hispanic. The population-weighting for ethnicity corrects for the undersampling of Hispanics, but since there’s no extra population-weighting for immigrants, it looks as though the immigrant share of the population has dipped from 20% to 10%.
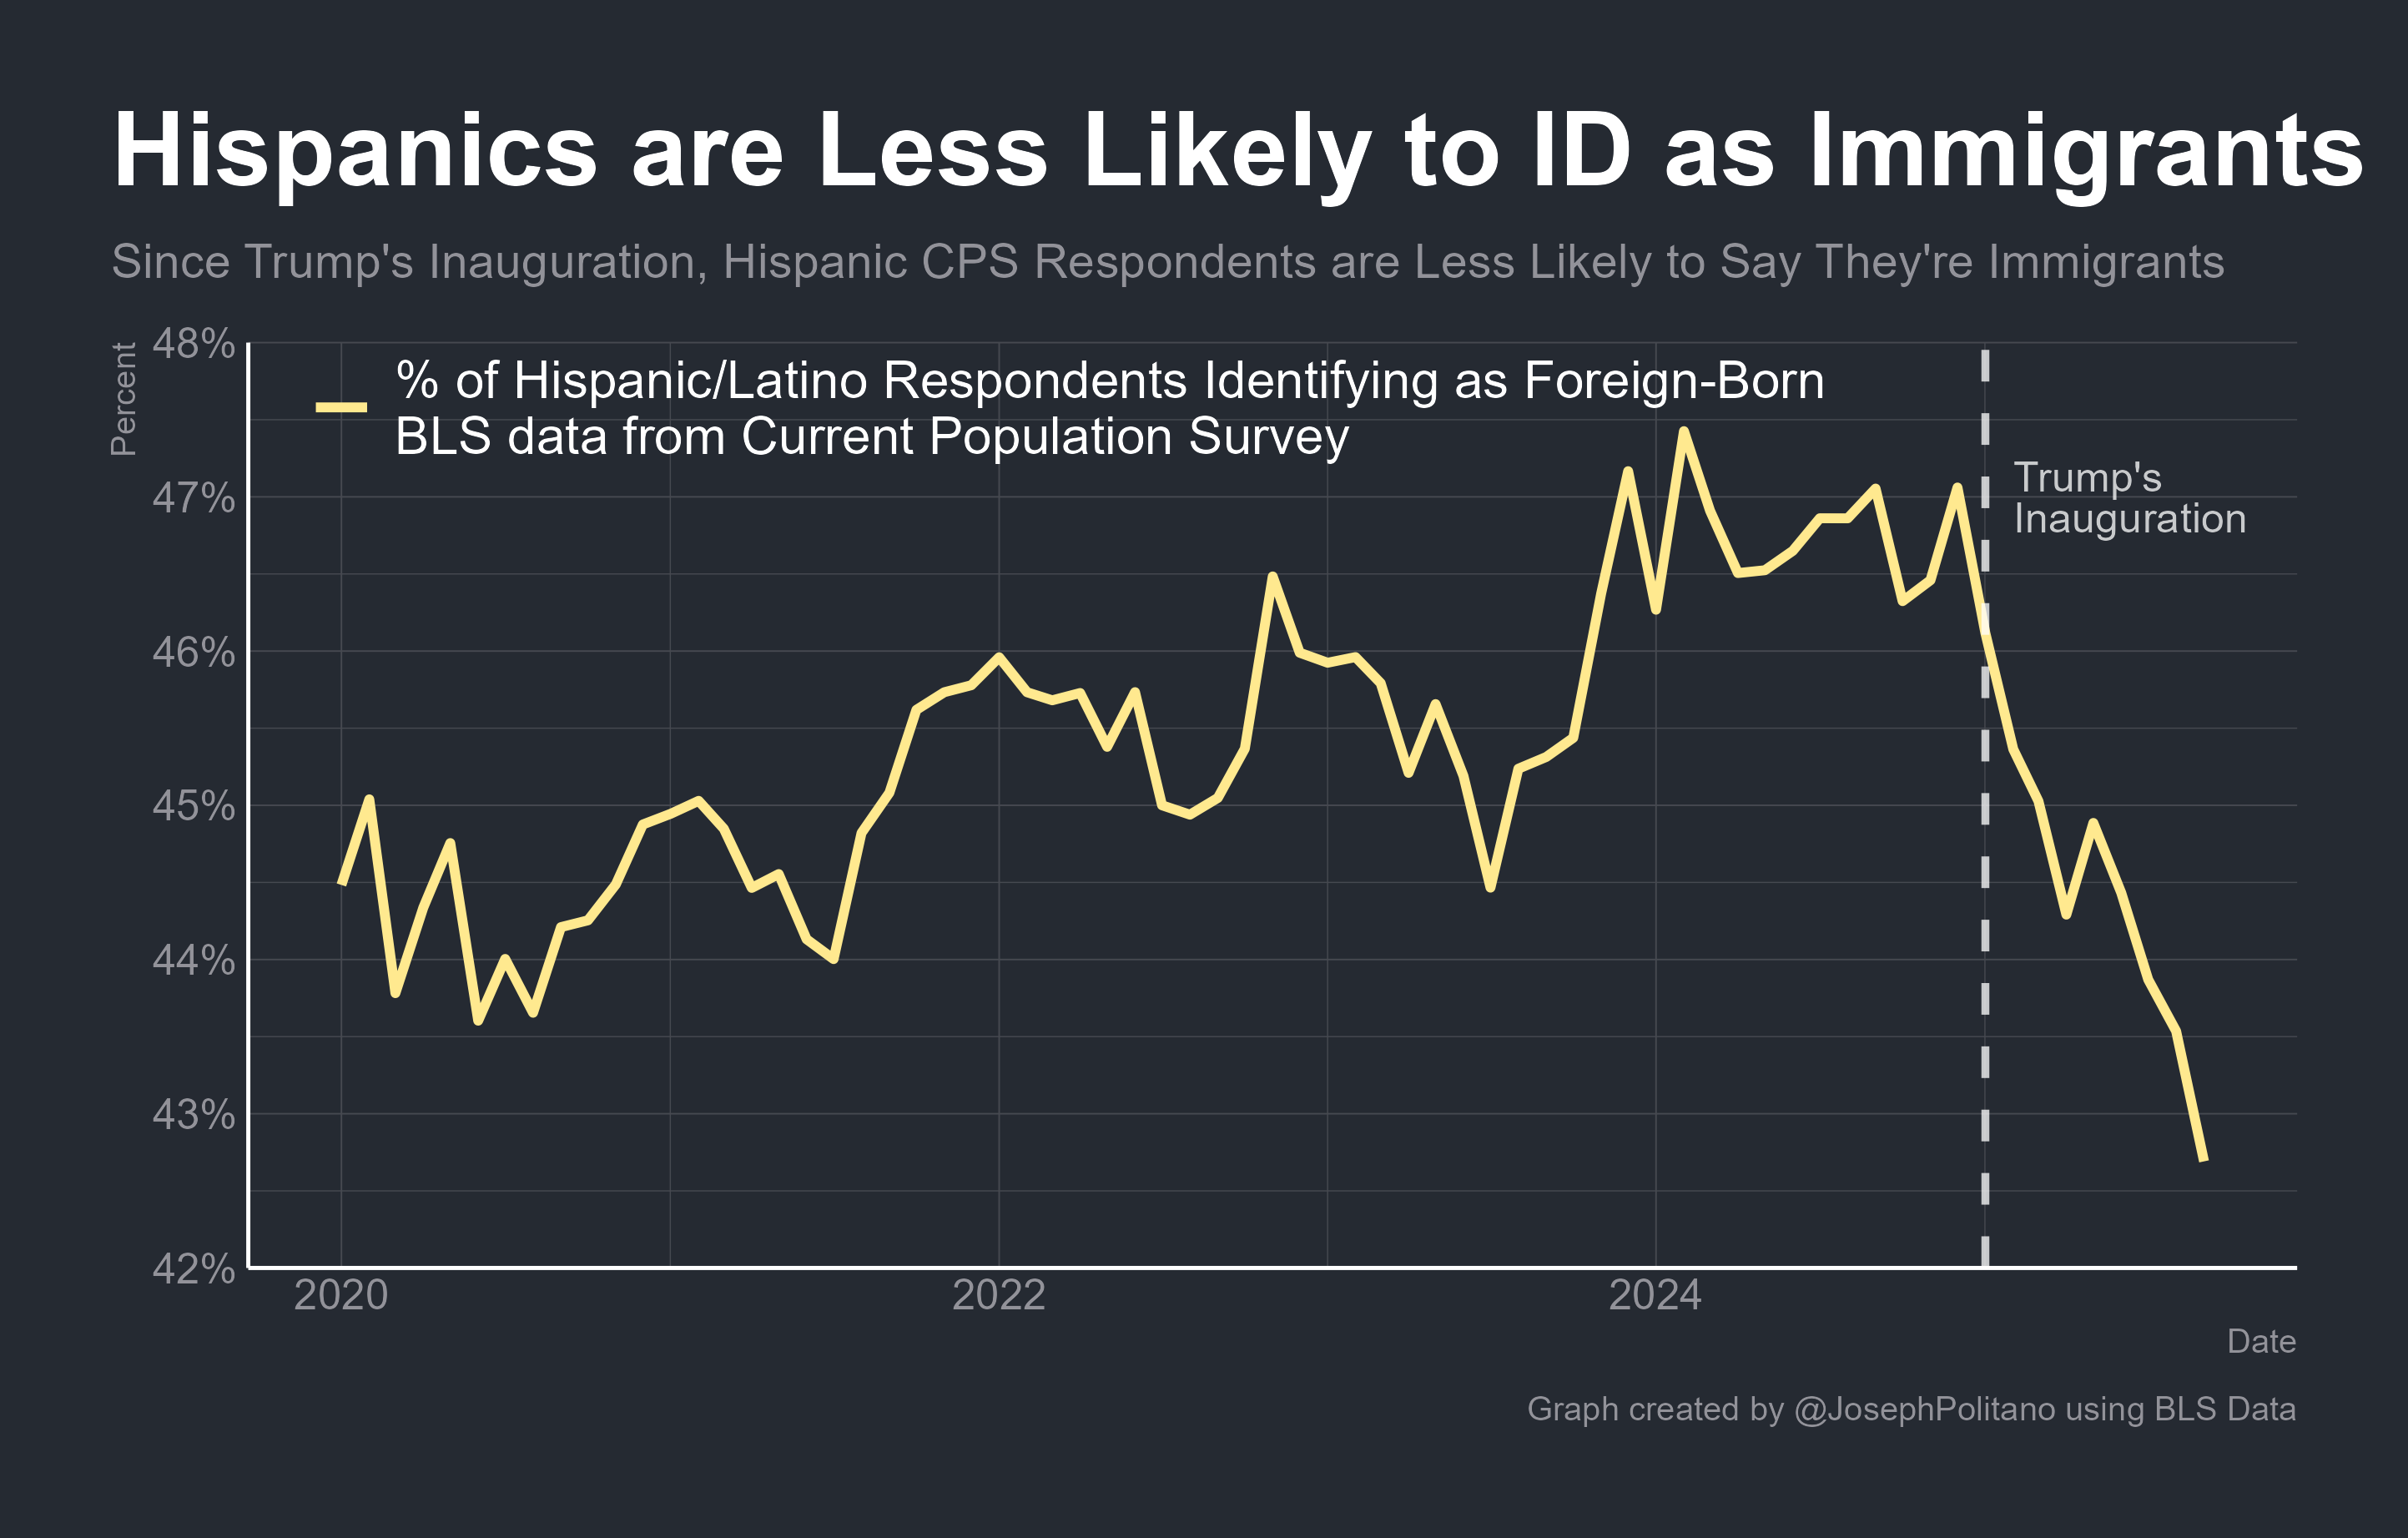
That’s a microcosm of what’s been happening in official US data this year—the weighted share of Hispanic CPS respondents claiming to be immigrants has dipped by more than three percentage points, hitting the lowest level in decades. The share of Black respondents claiming to be foreign-born has dropped by roughly two percentage points, and the share of Asian respondents has dropped one percentage point.
Only looking at the CPS data, it’s impossible to determine how much of this downturn in immigrant identification is due to deportations versus how much is just immigrants within the US becoming less likely to respond to surveys. This introduces an important second problem—measuring total population levels. Just as in the small town example, we know that some immigrants left after the immigration crackdown, but these leavers will obviously never be captured in surveys of the town itself. Given this, how can we possibly know the population of the town?
US employment data gets around this problem by projecting forward the population at the beginning of the year and simply never straying from those numbers. In January, they projected the over-16 US population would hit 274M in August, and August unemployment levels were calculated by multiplying the unemployed share of survey respondents to that population level. The same procedure is done to calculate the level of immigrants and non-immigrants in the US, which is where the Department of Homeland Security’s “two million fewer immigrants” figure comes from.

Yet because aggregate population figures are unchangeable constants in between their yearly benchmarkings, this means the same DHS figures that show a decrease in immigrants also show a massive increase in native-born adult populations. That increase is flatly impossible, as we have great records of US birth/death rates and know that 6M extra full-grown adults could not have appeared in the last few months. Thus, when the White House brags that “Over the past year, more than 2.5 million native-born Americans gained employment”, this is simply not the case—the share of native-born Americans with jobs has not budged, the US just erroneously thinks there are more native-born Americans because immigrants aren’t answering surveys. To return to our small town example, it’s as if you determined the population was 1000 at the start of the year and saw the immigrant count drop by 100 and thus presumed 100 more native-born residents appeared out of nowhere.
Beyond the unrealistic native-born counts, there are more reasons to doubt the accuracy of current CPS immigration data. If a net two million immigrants had actually left the United States since the beginning of the year, the country’s population would be shrinking at the fastest rate on record. Given that the vast majority of these immigrants are working-age employees, the US workforce would also be shrinking at the fastest pace ever, and payrolls would likely be falling by more than 100k per month. Actual payroll data are definitely weak, but are not shrinking anywhere near that fast, meaning the CPS is likely vastly overstating the decline in immigrant populations.

Yet answering how much CPS is overstating the immigrant decline is nearly impossible at this point. While the lack of massive payroll declines is enough evidence to know the CPS immigrant counts are inaccurate, it’s also impossible to calculate the true decline in immigration by working backwards purely from payroll data. The majority of recent immigrants are legal asylees with work permits, and stripping those asylees of legal status will show up as declines in payroll data—yet many legal and undocumented immigrants are self-employed, agricultural workers, contributing to family businesses, or get paid under-the-table in ways that make payroll data unable to fully count them. However, even looking at CPS Household Survey data adjusted to exclude those types of workers and therby match nonfarm payroll concepts shows a persistent, significant gap between the two measures that did not exist pre-COVID. That means either official population counts are (still) underestimating the size of recent immigration flows, payroll counts are underestimating the speed of job losses, or some combination of the two.
The next key data will be the census annual population estimates released in December, built off the more comprehensive American Community Survey results, followed by the updated CPS population controls in January. At that point, we will know much more about the size of the immigration downturn, but even still we will be relying on six-month-old data that fails to capture the full extent of the shifts in US immigration flows.
Conclusions
Given all that we do not know about current US immigration flows, what data can we rely on? First are the employment rates among immigrants and non-immigrants. While measured employment levels are heavily distorted by how many immigrants answer government surveys, the share of those respondents who report having a job should be much less affected. Obviously, to the extent that immigrants are pretending to be native-born in surveys they will distort the native-born data, and to the extent they avoid surveys they will cause the sampled foreign-born population to become unrepresentative. Yet the distortions to employment rates caused by immigrant response issues should be comparatively much, much smaller than the distortions caused to employment levels, especially for the data on native-born Americans. This represents the best information we have on the recent effects of Trump’s immigration crackdown on the US labor market.

From that data, it’s extremely clear that working-age native-born Americans have not seen any substantial increase in employment rates over the last year—in fact, the share of them with jobs has actually inched down compared to 2024. Employment rates among immigrants have decreased slightly more than for native-born Americans, but the decline is also only marginal.

On the flip side, unemployment rates for native-born Americans have been rising steadily and are now up 0.5 percentage points compared to this time last year. Unemployment rates for immigrants have actually fallen 0.1 percentage points over the same timeframe, meaning US-born workers are more likely to be unemployed than foreign-born workers today.
We may lack plenty of clarity on how immigration is affecting the aggregate US labor market, but the data we do have still unequivocally rejects the idea that mass deportations are delivering big wins for American-born workers. This should not be surprising given the decades of empirical economic research showing that immigration does not drive down wages or increase unemployment, but it highlights the core flaw with the administration’s strategy of touting deportations as an economic panacea. We may still lack the data for a proper accounting of the economic costs of Trump’s immigration crackdown, but we can already say it’s not delivering the promised benefits.
Wow just want to say this is extremely well written and explained, given the (lack) of data that we have. This comment section is usually a bit more nuanced and informed, and I'm bummed for Joey that the commenters feel the need to respond to this substantive research in this way. Please keep up the well informed, nuanced and accurate reporting.
Hey Joey just want to give you _one_ positive comment. I like the red letters on the charts you say are misleading. <3 that's good Internet