The Most Important Inflation Indicator Shows More Cooling Ahead
Rent Growth in New Leases Continues to Normalize, Signaling Further Upcoming Decelerations in Official Housing Inflation Data
Thanks for reading! If you haven’t subscribed, please click the button below:
By subscribing you’ll join over 37,000 people who read Apricitas weekly!
Rising rents are now the primary driver of growth in the Consumer Price Index—over the last year, shelter costs have risen by 6.7%, and since they make up 1/3 of the CPI basket their impact on headline inflation currently dwarfs all other major components. Shelter inflation is also a uniquely critical target for monetary policy—it is perhaps the subcomponent most directly influenced by macroeconomic conditions and therefore the most “core” part of overall inflation. However, official data on shelter prices have a major flaw: they lag market developments significantly.
The Bureau of Labor Statistics’ (BLS) measures of shelter inflation are based on contract rents (that is, what existing renters are paying today) which gives them the most accurate possible picture of households’ real expenses. But this also means they are mostly tracking prices for leases signed months or even years ago—movements in new lease prices are only reflected in the official data well after the economic phenomena that drove them have passed. Getting an accurate picture of the current drivers of rental inflation requires a different way of analyzing the data.
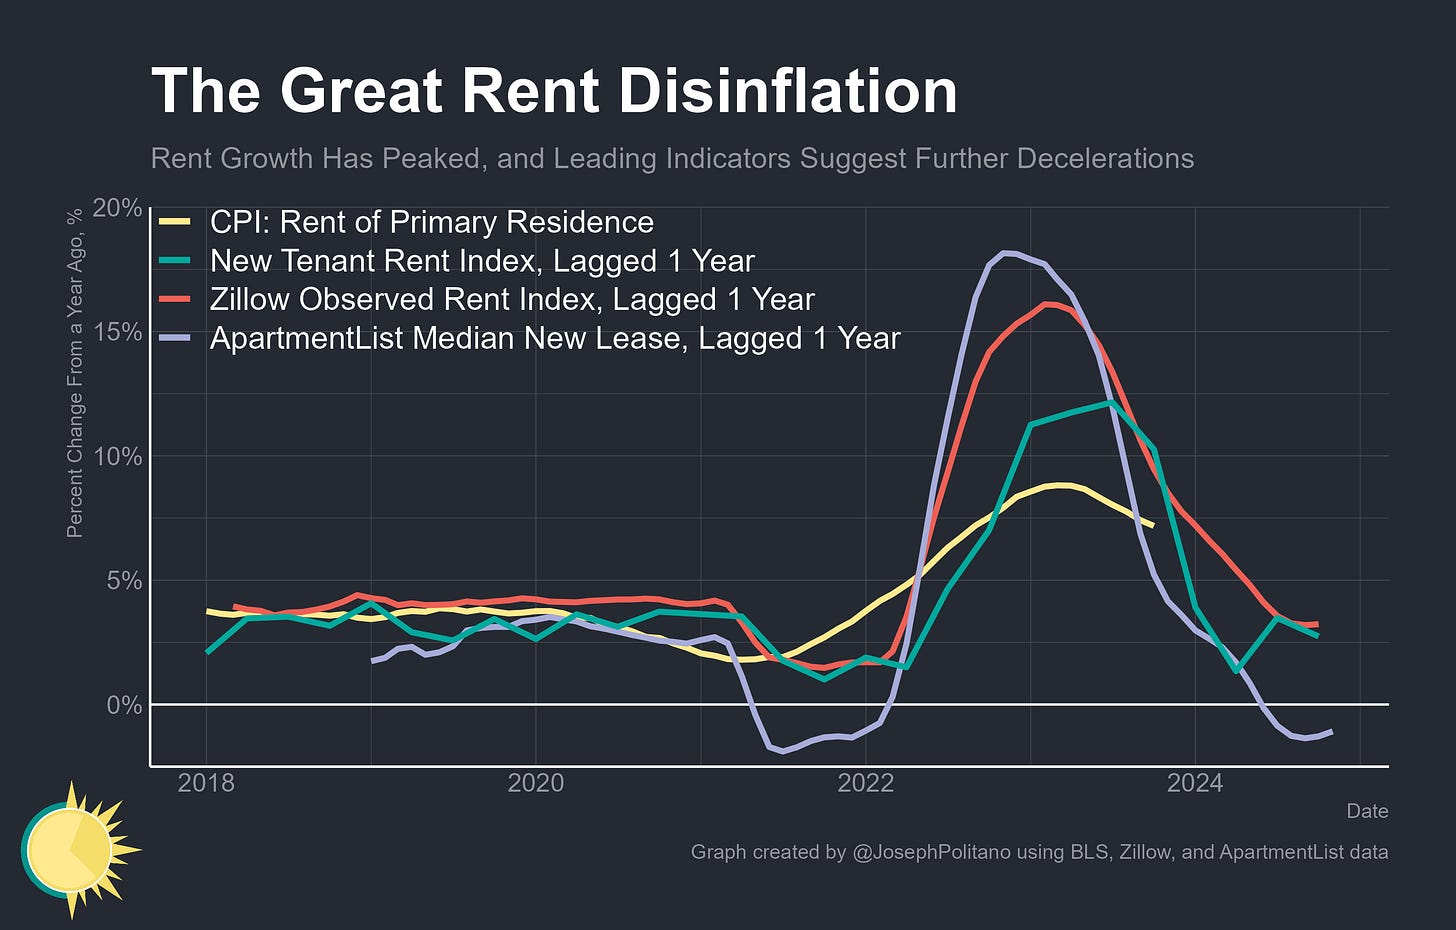
That is where one of the most important new inflation indicators comes in—the New Tenant Rent Index (NTR, formerly the New Tenant Repeat Rent Index) created by BLS & Cleveland Fed researchers Brian Adams, Lara Loewenstein, Hugh Montag, and Randal Verbrugge. I’ve written about the measure twice before, but to recap, they use the same underlying microdata as the official CPI shelter measures to look only at price developments among the subset of housing units where new tenants have signed leases, giving a much better read on where the housing market is now and where official CPI housing inflation is headed. Earlier this year, the NTR was showing significant disinflation in rent prices that have since begun passing through to decelerations in CPI shelter prices—and recently released NTR data through the third quarter suggests that even more stabilization is yet to come.
Indeed, a variety of private measures of new lease prices corroborate the normalization seen in the NTR—growth in new lease prices as observed by Zillow is now slower than before the pandemic and median new lease prices have actually fallen over the last year according to ApartmentList. Although the precise numbers vary significantly, they all tell a relatively similar story—price pressures in the housing market have faded back to relatively normal levels, and the CPI is decelerating as official data slowly updates to reflect that fact.
How Quick Will Official Rent Prices Decelerate?
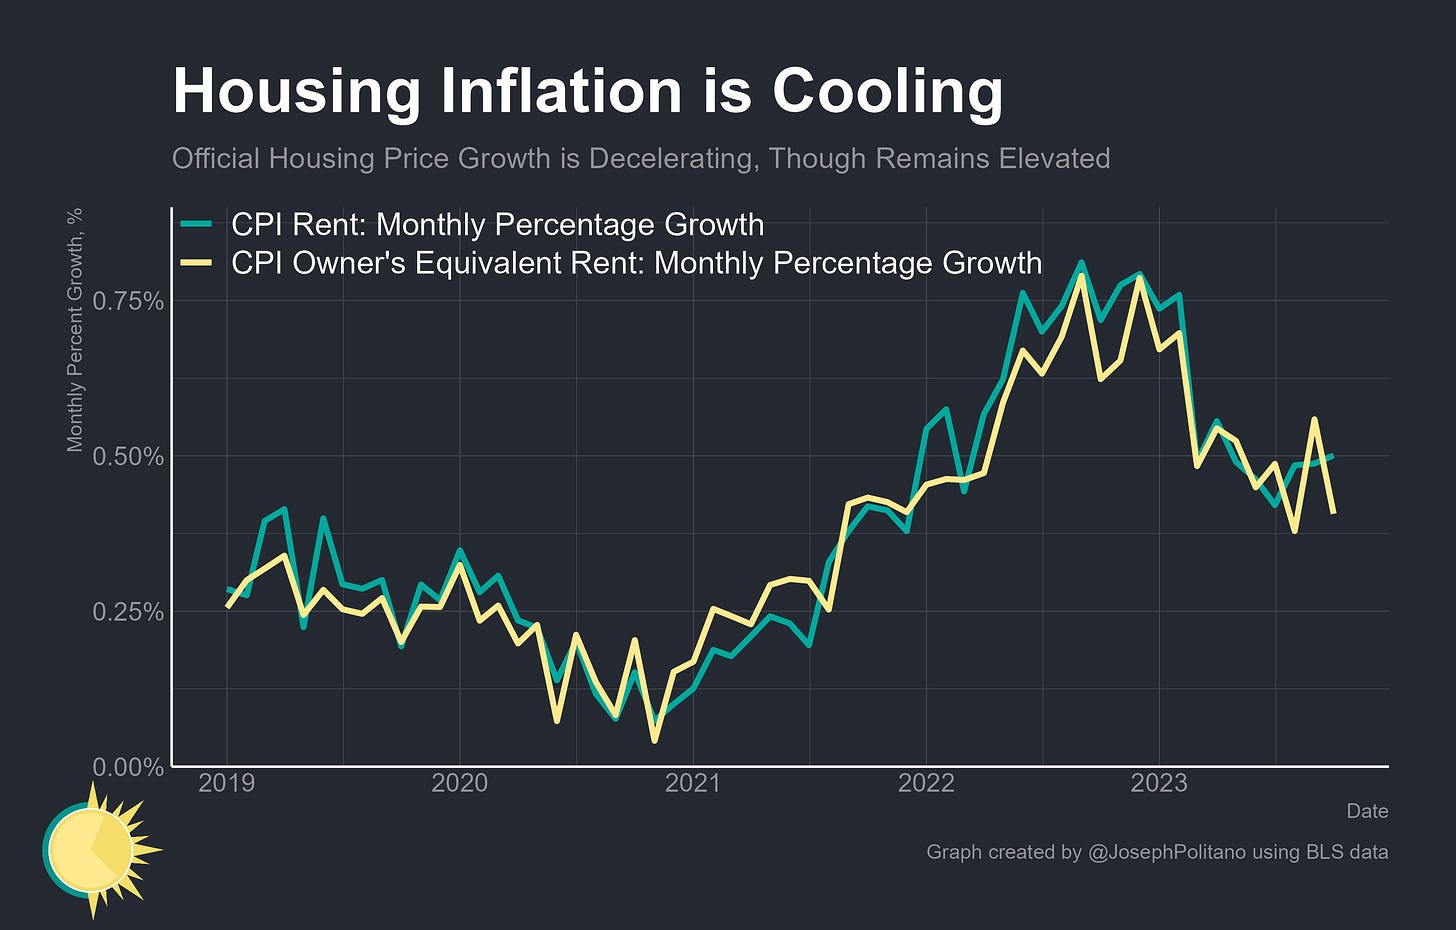
The precise pace and timing of that upcoming deceleration, however, is harder to estimate. Most of the time, average US rent growth moves at a fairly stable clip and large movements are uncommon outside of tectonic events like recessions, of which there have only been two in the last 20 years. That leaves precious little data available to measure the lag between prices for new tenants and prices for renters overall, which resulted in early estimates being based on the gap of 6-7 months between the low-points of growth in private-sector datasets on new leases and growth in official CPI shelter data during the 2020 recession. The BLS researchers pegged the lag at roughly 12 months, but it’s starting to look like deceleration could take even longer than that—so far this year, month-on-month CPI rent inflation has only taken a partial step down from its recent highs and the cumulative increases have already well outpaced the NTR growth seen in all of 2022.
Another limitation caused by the lack of historical data is that we don’t know to what extent the CPI rent data follows the level versus the growth rate of NTR. In other words, will the CPI data just tend to match last year’s NTR growth, or will it have to grow even faster to make up for periods of slower growth in the more distant past? In Q1, this distinction looked irrelevant—both the level and growth rate of NTR and CPI rent data had converged—but the debate has reignited as the two index levels diverged again this year. I personally continue to believe the growth rate is the most relevant connection—after the 2008 recession, CPI rent levels completely diverged from NTR levels even as the growth rates reconverged—but it is still the source of open uncertainty going forward.
Plus, it’s worth remembering that the most recent NTR data comes with significantly higher uncertainty bands due to the index’s methodological limitations. The two most recent quarters of data have much smaller sample sizes since the CPI’s housing survey measures the rental prices for units only once every six months, meaning a unit could get a new tenant in January but would not be surveyed and added to the sample until May. This makes readings for the most recent quarter subject to significant possible change—the initial NTR print for Q1 2023 suggested zero year-on-year price growth, but was revised upward as new data came in over the subsequent two quarters. The combination of evidence from public and private sector data makes the slowdown in new lease price growth impossible to deny, but the precise extent of the deceleration remains hard to determine.
Conclusions
More broadly, it shouldn’t be surprising that we’ve seen decelerations in both the leading and lagging indicators of rent prices as the underlying drivers of nominal housing demand slow. Growth in Gross Labor Income—the aggregate wages and salaries of all workers in the economy—continues to decline as the labor market slows toward normal pre-pandemic growth rates. Given how tight the relationship between cyclical growth in employment/wages and housing inflation is, a deceleration in NTR has naturally followed the slower labor market of the last year.
Part of the data story is also the story about the data—the NTR was originally addressing a niche academic question about price index construction but rapidly became an item of outsized interest as its results became key to fully understanding the inflationary environment of the last few years. The authors responded by engaging with the public and policymakers, improving the methodology of their work, and providing ongoing updates to the data series. The NTR will now be published on a regular quarterly basis, just a few days after the regular official CPI report, allowing public access to high-frequency data on the current drivers of rent inflation as they happen.


I hope you are right.
Do you have any thoughts on how rent inflation making up such a large portion of inflation could impact the fed’s interest rate? My understanding is that a higher interest rate has a more complex relationship on mid-long term rental prices since higher interest rates discourage new building, decreasing supply.